Showing posts with label fixed income. Show all posts

Monday, June 21, 2021

More on Interest Rates and Home Prices

Some follow-up thoughts on yesterday's post.

There might be some more to think about regarding interest rate sensitivity and local supply constraints.  I asserted yesterday that the decline in yields from 2000 to 2005 was concentrated among the more expensive cities, but that yields remained relatively stable in other cities during that time.  One implication is that expensive cities may be more rate sensitive.  I am unusually flummoxed by the patterns here for some reason.  But, digging around some more, I think I have become less sure of my intuition about sensitivity to interest rates and about relative housing yields across metros.

This first chart suggests the reason for expecting more yield volatility in expensive cities and possibly more sensitivity to interest rates.  Clearly, over time, high rents have become an increasingly important factor in housing markets.  Systematically, where rents are higher, gross yields are lower.  And, where rents are low, yields seem to remain relatively stable over time. The relationship between rent levels and yields moves up and down through hot and cold markets.  In other words, a bit counterintuitively, where rents rise, the rent/price ratio declines and becomes more volatile.

Data from Zillow.com affordability measures
But, when I look more closely at cyclical changes, I just don't see the pattern that this suggests there should be.  During the 2000-2005 boom, the Closed Access cities and the Contagion cities experienced anomalous declines in gross yields.  Long term interest rates also declined during that time, but I think the decline in yields in those markets was a result almost purely of these anomalies.  In the Closed Access cities, the anomaly was mostly continued strong rent inflation, and in the Contagion cities, it was from short-term price surges having to do with big shifts in migration that stressed their local markets.  Taking the Closed Access and Contagion cities out of the mix, in the rest of the country, if anything, housing in cities with higher yields was somewhat more sensitive to changing interest rates than housing in cities with lower yields.

As housing has moved through the aftershocks of the boom and the crisis, this seems to continue to be the case.  Once those anomalies from 2002-2006 worked their way out of the system, housing seems to be only somewhat sensitive to long term rates, and it is more sensitive to rates where housing is less expensive.

Zillow has detailed rent data going back to 2014.  Looking very broadly at the numbers up to 2014, gross rent/price was in the same range that it had been in the 1990s, and that this was more or less the case across MSAs.  Over that time, 30 year TIPS rates had declined from about 3.5-4% to around 1%.  One could suppose that this is because housing yields are not rate sensitive or because shifts to very tight lending had added a premium to housing yields, counteracting the change in TIPS rates.

I'm working very broadly here, but it appears that there could be three general forces at work here. (1) expected rent inflation, (2) long-term real rates, (3) tight lending since 2007.

In "Shut Out", being a little more thorough, I suggested that expected rent inflation could explain differences in home prices across cities, plus about a 20% price increase due to declining rates. Rates have declined about that much again, since the boom.  These two factors may be correlated, because if low rates trigger more home buying demand, that should lower rents where supply is elastic and raise rents where supply is inelastic.  It's complicated.

From 2014 to about September 2019, housing yields appear to have declined the most in metros with higher yields.  This changed after September 2019, and maybe this has mostly been due to Covid issues, but since then, yields have declined across the board.  I suspect that part of what is going on is that there has been a temporary decline in rents in the expensive, low yield cities, which has temporarily lowered their yields.  As those rents recover, yields in those cities will move back up.  So, it appears that there is a systematic change since 2014 of yield compression.  Yields in low-yield cities are staying about the same and yields in high-yield cities are declining.

In any case, there is a striking difference between this recent move in home prices and the 2000-2005 move.  There are no anomalous cities here.  The changes in yields are relatively similar across cities, and, apparently, correlated with existing yields.

This shift could reflect at least three factors:

1) Unsustainable bubble activity.  This is always a popular choice.  I am skeptical, of course, because in general the whole existence of this project of mine owes itself to discovering evidence, time after time, that has contradicted these types of explanations.  Also, as with so much housing data, the difference between cities dwarfs the changes within them.  Should we call a decline from a 10% yield to a 8% yield a bubble when the country is full of cities with 6% yields?  This would call for tight monetary and/or lending policies.  Of course, I think that is likely the continuation of a wrong perception that has been knee-capping our economy for 15 years now.

2) Maybe prices in high-yield markets are more sensitive to interest rates.  In that case, rising rates (if they ever come) might be associated with declining prices.  I don't see much sign of loosening lending standards.  Most of the activity is still among those with high credit scores.  If that is the case, loosening regulations on mortgage lending could be a useful countermeasure to help keep prices from collapsing if prices are sensitive to rising interest rates.

3) Maybe the convergence in yields is happening because all cities are becoming supply-deprived.  In that case, strong growth and generous lending will be key.  Why might this be the case?  Building has been much lower in affordable, high-yield cities since 2005.  In this chart, there are a few outliers well below the regression line.  Those are Contagion cities who were especially walloped by the financial crisis (Phoenix, Las Vegas, Orlando, etc.).  Other cities have a quite high correlation.  Building has been low in affordable cities.  I attribute this to tight lending.  These cities tend to have lower incomes.  And, because of this, rents have been rising broadly across MSAs.  Recently, rents have moderated or fallen in the low-yield cities because of Covid migration.  In any case, less building could mean that buyers in all metros expect rents to be strong.  This can be seen in vacancy rates, too.  Vacancy rates have always been low in the low-yield cities.  Vacancies in other cities are declining too, because of the lack of building.

https://fred.stlouisfed.org/graph/?g=EU8h

Of course, I would expect some combination of 2 & 3.  Surely there is some sensitivity to real long-term interest rates.  The questions are how sensitive home prices are to interest rates, how that sensitivity might differ across cities with different supply elasticities, and how much tight lending standards may have altered that sensitivity.

I thought there might be more anomalous movement among MSAs in the recent market activity.  Austin, for instance, might have seen an unsustainable decline in yields, as the Contagion cities had before 2006, because of a big migration shift.  I suspect that tight lending plays a role here.  In 2003-2005, migration led to more building.  And, possibly the migration was more targeted at certain cities than it is today.  But, because entry level housing is greatly obstructed by tight lending (and because of supply chain issues related to Covid), there hasn't been as much of a supply response in these markets recently.  So, rents have been rising in cities that tend to take in more migration in recent years.  Migration is pushing up prices, but more so than in 2005, it is pushing up rents, so the Contagion cities aren't anomalies in terms of yield.  And, since the migration is related to lower demand for Closed Access residency, the Closed Access cities are experiencing some anomalous decline in yields, but this is coming more from declining rents than from rising prices, and will likely reverse or moderate as Covid passes.

Sunday, June 20, 2021

Interest Rates and Home Prices

 A couple of quick thoughts on recent home price appreciation.

In graph 1, I estimate a national median gross rent/price yield from Zillow rent and price data.  I compare it to the 30 year TIPS (real) interest rate (plus 8%).  Certainly a case can be made that some of the recent price movement has been related to declining real long term yields.  However, without more historical data, this doesn't tell us much.  Two measures both moved in a certain direction over a period of time, and so it's easy to match them up on the y-axis.

Here is a longer series with similar measures.  Here, I estimate the national average gross rent/price level with total rent/total residential real estate value for owned homes.  I also used the CPI rent inflation measure with the Case-Shiller national home price index, with a scaling constant as a second version of the estimate.  Both estimates of rent/price yields follow similar trends.

Here, I use a 30 year TIPS bond issued in 1998 and then in more recent years the general estimate for 30 year TIPS yields.  Here I only added a 3% spread to the TIPS yields.  Part of the difference is that the mean yield is lower than the median yield. (Price/rent is not the same across the market.  It is systematically higher where rents and prices are higher.)  Part of the difference is that we imposed a one-time shock on housing during the financial crisis, adding a 2-3% spread on housing yields compared to other assets, so the spread in the first graph from 2014 onward is much higher than it had been before.

https://fred.stlouisfed.org/graph/?g=ESSe

When I first started looking at these things years ago, I excused the pre-2006 price increases with this relationship.  I still more or less stand by that.  It isn't controversial to say that home prices are related to interest rates. In fact, I think it helps clarify the analysis to show that it is specifically real long-term rates that seem to correlate with housing yields.  But, even in 2005, that doesn't tell the whole story.  Rent/price yields are not uniform across cities.  They decrease systematically where rents are high.  Some of that might be attributed to expectations of future rent increases.  Some of it might be attributed to lower cost of ownership where rent is a product of location rather than structures and services.  In any event, before 2000, gross housing yields had been between 6-7% for some time, and after 2000 they continued to be in that range in most cities.  In some cities like LA or NYC, they declined to more like 3-4%.  The aggregate yield around 5% was an average of a country increasingly becoming bifurcated into at least two different stories.

So, it may be that the correlation between 30 year TIPS and housing yields from 1998 to 2008 overstates the relationship.  In most places the gross housing yield didn't decline as much as the 30 year real rate.  Yet, even if one assumes that a 2% spread remains in place between long term real rates and housing yields, the recent drop in real interest rates is enough to support recent home price increases, even if the relationship is slight.

Actually, I think the causality may go both ways a bit.  In other work, I have mentioned that housing used to be cyclical in terms of quantity and now, because we have obstructed construction so much, it is cyclical in terms of price.  It is hard not to notice a similar regime shift in interest rates.  Before 2000, real interest rates were relatively stable, and changes in interest rates were largely related to inflation expectations.  Since 2000, real long term interest rates have become strangely volatile.

In the mid-20th century, housing yields remained stable because when rents increased, a lot of new homes were built until rents declined again.  All those new units required capital.  Mortgages, construction loans, home equity.  An increase in demand for investment (in generally safe assets and securities) drove GDP growth higher and put upward pressure on interest rates.

There is a lot of concern about a lack of safe assets, which is driving down interest rates.  Homes in California used to be safe assets.  They aren't any more.  They are risky investments in a cartel.  Mortgages used to be safe assets for investment, but many aren't legal any more, so the trillions of dollars worth of new homes they would have funded, which also would have been safe assets in Texas, Nebraska, and Tennessee, also don't exist.

So, there is an interesting set of interacting variables here.  If inflation rises, I don't think that will have much effect on real home prices or construction activity.  If real rates rise, which will be associated with real economic growth (and probably with a mitigation of short-run inflation), then it should have a moderating influence on home prices.  But, unless mortgages can flow, multi-unit projects can be easily approved, and construction can run hot, then rents will continue to rise and long-term real interest rates will continue to be limited.  In that case, it seems like a "hot" market is likely to remain, with housing growth (but at historically low construction rates) and high prices (low housing yields), while the "have nots" who are under the "tyranny sincerely exercised for the good of its victims" will face rising rents.

I suspect that a construction boom would both lower rents and raise real long-term interest rates.  But, the boom must come first.  In the meantime, housing is in a peculiar space, where we should expect there to be some sensitivity to rising rates if the economy continues to recover, yet also housing yields continue to retain at least a 2% spread to long-term 30 year rates, compared to pre-crisis norms, so that nobody should expect home prices to revert to earlier relative levels (especially as rents continue to rise).

Tuesday, January 5, 2021

December 2020 Yield Curve

 The yield curve looks pretty good.  Long term rates still are recovering.  The expected date of the first short term rate hike also appears to be coming closer.  This all seems like good news to me.  All in all, pretty good monetary management for the COVID-19 recession, I think.

It seems to me that a short position in early 2023 Eurodollar contracts has a nice risk/reward balance.  Not much room for downside (declining interest rates), but quite a bit of room to run higher (higher interest rates).


Thursday, November 12, 2020

October 2020 Yield Curve Update

 The yield curve has taken a strong bullish move as a result of the election and the Covid-19 vaccine progress.  The long end of the Eurodollar curve is nearly back to the pre-Covid level.

The date of the first rate hike remains in mid-2021, but the escape velocity has increased significantly.  Forward inflation breakevens remain level at about 1.6%, which suggests that the recent improvement has been due to real shocks.  The Fed probably still has room for more traditional accommodation.


Tuesday, July 7, 2020

June 2020 Yield Curve Update

The yield curve remains at about the same place it was a month ago.

Since the mid-March peak of optimism after the initial reactions to COVID-19, yields have declined, which would suggest that the Fed could do more in terms of basic nominal stimulus.  But, the decline in long-term yields has been real.  Inflation expectations have inched upward, though tepidly.

I don't have an opinion about the various lending programs in place, but it seems like there is plenty of room for the Fed to simply buy Treasuries until inflation expectations move above 2%.  A steeper yield curve would be a good sign.

In the meantime, the low point of the inversion looks like it's moving ahead in time, which is not a good sign.  Along with a steeper yield curve, it would be nice to see market expectations of sooner increases in short term rates.  The Fed can't cure COVID-19, but it can minimize the costs and dislocations caused by nominal decreases in incomes.  There is no reason for the Fed to let the market expect the yield curve to be inverted until 2022, but we might be headed there.

That being said, the Fed has been more active than what I would have expected.  I appreciate the new direction.  They aren't creating nominal economic crises like they did back in 2008.  But, there are parallels, still.  In 2008, during the month after Lehman Brothers failed, when markets were being tossed to and fro, and intensive debates raged about bailouts, TARP, and all the rest, the Fed sat on a 2% Fed Funds target rate - a target rate that was so disastrously high they never really managed to hit it.  In the midst of all the debates about unconventional policy efforts, it seems that it didn't occur to anyone to do conventional monetary policy and lower the rate.

We have sort of a similar issue now, with all the special lending programs, all the kvetching online about who got it and who didn't, etc., and in the meantime, the Fed could be purchasing many more Treasuries than they currently are.

Monday, June 8, 2020

May 2020 Yield Curve Update

 The yield curve (using Eurodollar futures) has undergone a series of shifts with the coronavirus pandemic.  In the first graph, we can see that starting from the end of January, the whole curve shifted down by early March.  It shifted down more by March 10, as the extent of the pandemic became worse.  Then, it steepened over the next week as, across the US, cities, states, and citizens took action.

Then it shifted down again in late March as the pandemic worsened in the early weeks of the lockdown.  Then it steepened again over the course of April and May.

The result of these shifts is that short term rates are much lower than they were at the beginning of March but long term rates are about the same as they were.

I would say that we have encountered a pretty hairy real economic shock, but the Fed has done a decent job of countering that shock so that the nominal shock is lower than it could be.  (Five year inflation is still under 1%, so there is room for more, but obviously the Fed has been very active.)

The second chart here is an estimate of the first month when short term rates are expected to rise.  Before the pandemic, rates were not expected to bottom until September 2021, and that date was potentially moving out in time, just like it did after the GFC when the Fed would prematurely stop doing quantitative easing.

That was the main danger of the pre-COVID economy, that the Fed was pulling back on nominal growth just a little too much.  That, by itself, is unlikely to cause a crisis or an intense contraction, but it does put the economy in more danger of running into problems, especially, as the past 3 months have made clear, we never know what's around the corner.

The shock we did get was strong enough to kick the Fed into recovery mode, so I think the stock market has basically reacted to an exchange of risks.  We got a real shock, but now we are less likely to have whatever low-level monetary stagnation we were going to get otherwise.  If the expected future date of the first rate increase continues to push back to us in time (it's now at June 2021), then that might be evidence that the Fed has mitigated some of the real shock by moving into recovery mode.  Basically, this would create a deeper but shorter recession.

The next graph is my modified inversion measure.  Any spot below the trendlines is effectively yield curve inversion.  We are still technically inverted, but now the Fed has so many programs in place to provide liquidity there might be hope for recovery even if long-term yields remain low.  Understanding that is above my pay grade.  In either case, if 10 year yields can rise above, say, 1.5%, that would definitely be bullish.  Even moreso if the Fed misinterprets buoyant yields as some sort of headwind that calls for more stimulus.

In the meantime, it's a trader's market.  There are a lot of stocks still well below their previous highs and many stocks at all-time highs.  Their relative outcomes will depend on real developments.  A lot of people are talking about where the "stock market" is, but now really is a time where prices on individual stocks can present opportunities for acting on particular knowledge or simply for having the guts to take on potentially embarrassing positions that, nonetheless, have potential.

Friday, May 8, 2020

April 2020 Yield Curve Update

The Eurodollar charts are updated through today.  The Treasuries chart is monthly.

The Treasuries chart suggests that the yield curve is functionally inverted.  (The 10 year yield needs to get above the trendline.) Forward 5 year inflation expectations are below 1%.  There is a lot of focus on the targeted lending facilities, etc., but, as in 2008, the Fed could really just do more standard stimulus.  Just buy a bunch of Treasuries.  If the cash just ends up in excess reserves with no increase in forward nominal spending and inflation expectations, then buy more.

The Eurodollar curves provide a little more optimism.  It is good that in recent days, the long end of the curve has held up and lower rates are mostly from declining rates at the short end.  The Fed could do more, but it could have done less, too.

The last chart, which is the market estimate of the first rise in Eurodollar rates, suggests also that the Fed has stimulated somewhat, but could do more.  Before the coronavirus outbreak, I was worried that the Fed was just keeping monetary policy below neutral, so that the expected first date of an eventual rate increase was slowly moving back in time, similar to what had happened after 2008 each time they suspended Quantitative Easing operations.  I was looking for the expected first date of a rate increase to move back to December 2021, which would have been bearish.

I thought that the pandemic might trigger a response from the Fed that was less complacent, and actually shorten the length of a coming contraction, even if the contraction was deeper.  At first, this seemed to be the case, with the expected first date of a rate hike moving briefly all the way up to September 2020.  Since then, it has moved back to September 2021.

At this point, a lot depends on near term real shocks related to the pandemic.  But, higher inflation expectations would help, on the margin, I think.


Disclosure: I do not have a position in UBT any more.

Monday, April 6, 2020

March 2020 Yield Curve Update

Well, so much has happened, I hardly need to update the yield curve.  Coronavirus has given us one big push into the recessionary outcome that we have been tentatively dancing around for some time.

The first graph here is the comparison of the 10 year yield and Fed Funds Rate.  The imminent recession has pushed the neutral rates of both down considerably.  But, the Fed has been very responsive.

There are so many moving parts moving in such extreme directions, I really don't have anything to say at this point.  Normally, I would suggest that we should be hoping for 10 year yields eventually to run up above 1.5% or 2% as a first step to recovery, but it is all so complicated now, and the Fed makes it even more complicated than it needs to be, so for now I'm just going to watch.


 Here is the yield curve at several points since the early days of the coronavirus development. Short term rates have steadily moved down but long term rates have bounced around a lot.  Again, I'm not sure I have much to say. A lot of the movement on the long end may have been related more to market disequilibrium than to any systematic trends or expectations.  Again, I am in waiting mode.

Inflation expectations have declined to less than 1%.  As long as that is the case, there is probably a pretty tight limit to how high long term rates will go.

The one thing that might be even slightly informative this month is the expected low point of the Federal Funds Rate.  It had been at September 21 for a while, suggesting that Fed policy was expected to allow some sort of economic contraction that would settle in for more than a year.

But, the coronavirus has made everything suddenly more acute and one interesting result of that is that the expected low point of the Fed Funds Rate is now March 2021. It had gone as early as September 2020, but that might have been related to short term market disequilibria.

If this holds up, it suggests that the Fed has been spurred into a more vigorous reaction, and even though the recession will be much deeper than whatever was going to happen, we might recover more quickly because the Fed has jumped from a "minding the store" approach to a "whatever it takes" approach.

We have suddenly switched from a set of fiscal and monetary approaches that were, mistakenly, aimed at making American household assets illiquid, to a new approach where the Treasury and Fed are creating liquidity wherever they can.  Because the bias for the past decade has been so far in the other direction, there is a lot to be gained by this.

But, of course, the virus creates many uncertainties.

Friday, March 13, 2020

Long Term Yields as a call option

A long time ago, I played around with the idea that when yields are near zero, forward yields act more like call options on future interest rates than unbiased market expectations of future rates.

The second half of this post.

And here I discuss the idea.


What this means is that there is an unreliable relationship between long term yields and uncertainty.  That is because there could be uncertainty about the business cycle, or rising concern about a contraction, which would normally cause rates to decline.  But, there could also be uncertainty about the various potential states of the future.  For instance, let's say that the marginal expectation for 5 year forward rates is 0.5%, with a standard deviation of 0.5%.  What if there is a change in uncertainty that, somehow, leaves the marginal expected rate the same, 0.5%, but increases the standard deviation of that expected rate.  Since all of the expected future rates that were already below zero would still all just be truncated at zero, this would actually raise the market rate, because in those future scenarios where rates are higher, they wouldn't be truncated at zero.

In the chart here, think of each forward rate as the expected value of a range of potential rates, shown here as normally distributed expectations.  But, those distributions are truncated at zero.  The expected value of all potential scenarios would be higher than the median value because every value below zero would only count as zero.

Basically, this is just like a call option.  Call options can rise in value because, either (1) the expected future price of the underlying security increases or (2) the variance of expectations about the future price increases, making expected positive outcomes more valuable.

Yields have had some strange behavior this week, and I wonder if this could be part of it.  In options speak, maybe long term expected rates have been falling but with higher implied volatility this week.

I have been wondering when the right time is to sell long bond positions.  Earlier this week might have been the best time.  But, I suspect, because of this effect, when there is a positive shock from a Fed announcement or something that signals optimism to the market, the initial effect may be that interest rates decline quite a bit because there will be more certainty about the future economy.  I doubt that there will be a strong force pushing actual rate expectations much higher in the near term.  The net effect may be that the first move in long term rates will be to settle at a lower level that is actually more in line with what expectations are now, but which market prices are now biased away from due to uncertainty.

Treasury markets seem a bit unable to perform price discovery this week, and I assert that that is evidence in favor of my hypothesis.  If the Fed can get Treasury markets to calm down, long rates might decline.

One side effect of this would be that, if the Fed announces some big stimulus that calms markets, that should trigger declining long-term rates, and that will make it look like the Fed creates stimulus by lowering rates all along the yield curve.  I think that is not a useful way to think about Fed policy.  Stimulative Fed policy should cause the long end of the yield curve to rise.  In this case, it could very well cause median expectations of future rates to rise from 0% to 0.4%, but simultaneously reduce uncertainty so that the market rate falls from 1% to 0.6%, or something.  That would give a false statistical signal about how Fed policy affects the yield curve.


Disclosure: long UBT

Friday, January 3, 2020

December 2019 Yield Curve Update

The yield curve continues to press upward from the mid-year lows.  This is mildly bullish, but I would still say that the yield curve is in bearish, inverted territory (below the trendline in the second chart).  We may sit here for a while (several months?), but my guess is, per past patterns, that either 10 year yields will move up above 3%, and the Fed will keep the target rate low, and we might escape a contraction, or 10 year yields will remain close to where they are, and eventually the entire yield curve will move back down toward zero, and we will have some sort of contraction.  I don't think the contraction would be extreme, and it may not even bring much of a decline in equity markets.  The ingredients that made 2008 so disruptive aren't in place today.  The Fed appears to be ready to react to contraction without as much delay as they allowed in 2006-2008.  And, though perma-bears will always be with us, as are the poor (in the long run, maybe they are one and the same!), I don't get the sense that the same suicide cult mentality is so strongly shared as it was in 2008, when Americans would only be satisfied with some sort of financial meltdown.

So, in short, this month doesn't change my posture much.  I think the odds are greater than 50% that future near term yields will be lower than current forward yields, maybe a slight rise in unemployment and decline in equities if the inverted yield curve, as I see it, does signal some coming contraction, and housing that will probably look a lot like 1999-2001, at worst seeing a slight pause in growth.

Saturday, May 11, 2019

April 2019 Yield Curve Update

Sorry, I'm a little slow to this update.

The yield curve inversion remains in place.  The curve as of Thursday looked very similar to the levels at the end of March and April.  This seems to be a trading opportunity.  I consider a yield curve to be a signal rather than a cause.  During inversions, there is a bias in forward rates.  Something keeps forward rates from moving as far below short term rates as they should, which means that there appears to be potentially persistent profit available by shorting forward rates when the yield curve is inverted.

It seems like the trading position to take is to position for reversion while the Fed keeps the short term rate stable.  Forward rates will move up and down within a range.  Then, when the Fed moves the short term rate, forward rates will move out of the trading range.  If it lowers the rate proactively, forward rates will move up.  If it lowers the rate reactively, forward rates will move down.

It seems to me that the probable outcome here is that, on the first chart, 2019 will look like 2006 and 2007.  A brief vertical period eventually with a breakout to the left and down.

Keep in mind that I am actually a cocker spaniel and my master doesn't even know that I maintain this blogspot account, so I can't legally be responsible for your trading gains and losses, and you really shouldn't even be reading this nonsense.

Me


You taking actionable advice from this blog

Wednesday, January 2, 2019

Upside Down CAPM: Part 7 - Debt is Ownership

I was reading this piece on debt jubilee (HT: JW) and it occurred to me that this is an issue that gains clarity from the Upside Down CAPM idea. (In short, capital is inherently at risk.  It has a natural long term real rate of return of about 7%, which is basically the return on equity ownership.  Fixed income is a trade between capital owners in which the lenders are the true consumers.  They want to transform risky capital into riskless deferred consumption.  They pay a premium <earning less than 7%> in order to avoid risk.)

I have written skeptically about jubilee before.  The idea is popular because the first order effect is forgiveness of debts.  It is imagined to be a transfer from the powerful to the powerless.  But, that just isn't a very useful way to think of debts, in the aggregate.  We tend to think of debts through the prism of consumer debt, but consumer debt is more of a transactional device.  Most household debt is mortgage debt, which is a clear case of Upside Down CAPM.  The ownership of the house is split between an equity holder who takes responsibility for upkeep and maintenance and takes on the risks of market volatility, and the debt holder who exchanges those risks for a fixed return.  The only reason mortgage financing works is that home equity is, itself, very nearly a fixed income type of ownership, in which most of the return comes from rental value.  (That is one of the core problems with Closed Access housing supply.  It makes home equity less like fixed income and causes a breakdown that makes housing financing less functional.)

Thinking about jubilee from an Upside Down CAPM perspective helps to clarify this.  Modern economies have already incorporated jubilee financing deep into our economic systems.  Capital markets are already dominated by a financial security that automatically forgives the debtor all of their principal when they are unable to pay it.  That security is called shareholder equity.

Sometimes, borrowers (for lack of a better word) opt out of jubilee by selling fixed income securities instead of equity.

Incidentally, I wonder how much overlap there would be on a Venn diagram of people who think debt jubilee would be a great idea and people who think limited liability corporations have been a good idea.

The problem comes from contexts where selling equity is difficult or impossible.  The problem with selling equity as an individual is that this is essentially indentured servitude.  Where that can be managed safely (see, currently, Lambda School, which seems to be a great example of this) it can work, but it is difficult.  So, where jubilee is discussed today, it typically has a focus on things like student debt.

But, student debt is an anomaly.  It probably shouldn't exist in the way that it does, and it only does because it is subsidized by Federal guarantees.  Debt is a service provided by the borrower to the lender - providing risk free deferred consumption.  Students aren't remotely in a position to provide that service.  So, the government steps in to provide that service in their name.  But, since policymakers have not come to terms with the incoherency of this program, the program has been designed to leave many indebted former students in dire straits with unpayable debts that they should never have been in a position to take on.

I hope that developments like Lambda School can help lead us to a new financial technology that better matches funding with students, and creates an equity-like funding mechanism (a jubilee-eligible mechanism, as it were) for school funding.  That probably means being more honest about the demand for education, and the difference between the development of marketable human capital, which is a powerful source of economic equity and betterment, and education that is less vocational and is better viewed as consumption than investment.

Wednesday, July 25, 2018

Housing: Part 313 - The boom and bust through a "safe asset" lens

I'm sure I have covered some of this before, but I thought I would just walk through the financial crisis purely from a "safe asset" frame of reference, focusing on housing.


Source
First, here is a chart measuring the year-over-over percentage change in home equity value (total owned real estate minus mortgage debt).  The annual gains from 1998 to 2005 were similar in magnitude to the gains from 1967 to 1986.  In both cases, "demand" side factors were given a large place in the causal story.

But, "demand" side factors were really only a foundationally important factor in the earlier period.  In 1970s period, the rise in home equity was roughly divided between declining real yields which increased price/rent ratios, and rising general price levels.  So, rising home prices were somewhat paralleled in rising prices across the economy at that time - because rising home prices then were actually a result of demand-side factors.  High inflation, high NGDP growth, etc.  Since that period truly was broadly a demand-side event (punctuated by some supply-side shocks in petroleum markets), there was never social pressure to induce a decade of deflation to counter it.  That would be dumb, and everyone recognizes that.  So, Volcker's task was simply to tame inflation.  Nobody was demanding "market discipline".  I am not aware of a movement at the time pushing for broad nominal capital losses.

The period of the 2000s was not a demand side event.  It was caused by localized supply constraints.  So, in that period, rising equity was roughly split between declining real yields which increased price/rent ratios (just like the 1970s) and rising rents in constrained locations (not like the 1970s).  Those rising rents were the product of political obstruction.

And, this brings us to the topic of safe assets.  In the actual demand-side boom of the 1970s, homes were considered a safe haven from inflation.  In that context, homes were a safe asset - maybe even "safer" than normal.  Aggregate home prices were never far from replacement values.  There was no reason to worry about aggregate home prices collapsing in a functional economy.

In the 2000s, regardless of what specific causes you might assign to the housing boom, I think everyone can agree that rising home prices became unconnected to replacement value.  Homes in San Francisco don't sell for $1 million because of high lumber prices.  In other words, because the housing bubble of the 2000s was not a demand-side event, homes had become less of a safe asset.

So, thinking in terms of safe assets, from 1998 to 2005, real estate in the Closed Access cities (NYC, LA, SF/SJ, Bos., SD) went from less than $3 trillion to more than $7 trillion in total value.  (Data generously provided by Zillow.com.)  In terms of total assets, the American economy gained $4 trillion in value.  But, the very act of gaining that value meant the loss of safe assets, because those properties now have a very real danger of quickly losing much of their value.  So, really, during that time, speaking with a broad brush, the US gained $7 trillion worth of risky assets and lost $3 trillion worth of safe assets.

Now, it is true that in any time or place, real estate can lose value.  Former homeowners in a city like Detroit experienced the risk of loss as values declined, even though values there had never been stratospheric.  But here it is important to recognize the importance of income (imputed or cash) in real estate markets.  Frequently, because owners only experience income as an opportunity cost (opportunity profit?) through the rental payments they didn't have to make, the income factor in real estate values is forgotten and capital gains are treated as the only reason for ownership.  But, in real terms, income is by far the most important factor in real estate returns.  A house selling at a price/rent ratio of 10x can still be a decent long term investment even if it is razed in 30 years.  That is not so much the case for a home selling at 20x rent.

Real long term interest rates, measured by 30 year inflation protected treasuries, dropped from about 4% in the late 1990s to about 2% in 2005.  It was considered a conundrum that long term real interest rates didn't rise along with short term rates in 2004-2005.  But, already, there had been a loss of safe assets because a portion of the American housing stock had ceased to be safe.

Then, after the Fed started raising interest rates in an attempt, in part, to slow down residential investment, in the face of this shortage, the idea that home equity in Closed Access cities was not safe was intensified.  You can see this in the migration patterns out of those cities.  Hundreds of thousands of homeowners were selling and moving to other, less expensive, cities.  They sold their homes to more leveraged buyers who had less equity on the line.  A high LTV owner - especially an investor owner - holds something more like a call option than a fully at-risk equity position.

In a way, the private securitization markets clarified the new context of asset safety, because the old Closed Access owners took their capital gains and plowed them into AAA rated securities, which were more safe than their home equity had been.  And the mortgage securities that funded the new buyers were actually divvied up into risk classes.  Some of those risk classes were rated as risky bonds and some were even called "equity tranches".  Some of the investors in those mortgages rightfully considered their investments to be "equity".  So, in a way, the market incorporated this new reality into its structures.  (In the end, of course, the risk obviously reached beyond the equity tranches, but as I have written elsewhere, that was the product of a series of policy catastrophes that continue to today.)

Source
Most of the homeowners in LA who were selling and moving somewhere like Phoenix probably considered the market to be in the midst of a credit-fueled bubble.  It doesn't really matter why they thought their home equity was in danger.  It only matters that they did.  And, thinking in terms of portfolio construction, we can see that when they traded their million dollar home in LA for a $250,00 home in Phoenix plus $750,000 of money markets, CDs, bonds, etc., they were explicitly reconstructing their portfolios in order to remove an asset class that had ceased to be a safe asset and replaced it with other safe types of assets.  This is what was going on when the CDO market was blossoming in order to meet rabid demand for AAA-securities.

This is what was happening from early 2006 to late 2007.  Prices were fairly level, but there was a mass exodus from home equity.  This shows up both in collapsing housing starts and in falling outstanding levels of home equity.

By 2007, the entire real estate asset class - $25 trillion in terms of total value or $13 trillion in terms of home equity after mortgages - ceased to be safe.  This step in the process was largely due to expectations.  A national consensus that the acknowledgement and enforcement of a lack of safety in home equity was a signal of prudence, wisdom, and sophistication.  Of course, we all know better, but those other people are always greedily chasing after profits and forgetting that losses can be very real.  This is the story that you can find being told explicitly in the dozens of books that line the shelves of your local library about the boom and bust.  And there were highly leveraged unsophisticated investors, especially in the Contagion cities like Phoenix.  We weren't lacking in anecdotes to fill the narrative.  Narratives never lack for anecdotes.  There are always naïve speculators, greedy bankers, violent immigrants from disfavored ethnic groups, mal-informed leaders from the opposing political party.  In all political topics, whatever popular narratives might lack, it is never supporting anecdotes.

So, the second wave of lost safe assets came from a consensus acceptance of collapse.

The third wave of lost safe assets came after the crisis, when mortgage markets were tightened up sharply.  As a result, housing starts have remained at depression levels for a decade.  A couple trillion dollars worth of physical assets have not been created because of this.

So, when thinking about the safe asset shortage that keeps real long term interest rates low, housing plays an important role here, in three steps:

1) The loss of a few trillion dollars worth of safe assets when the value of Closed Access real estate rose to far above replacement value.

2) The loss of more than ten trillion dollars of safe assets when the value of most real estate in the US was expected to and allowed to collapse.  The fact that fixed income securities associated with housing lost their "safe" status has been the focus of public attention, and the false sense of inevitability has led most people to act as if those securities were never actually safe.  But, the losses in those securities are a secondary effect that only came about because of the much larger loss of "safe" status in the home equity asset class.  The Case-Shiller index fell nearly 40% in Atlanta from 2007 to 2012.  Losses associated with securities funding mortgages originated in Atlanta are surely a small fraction of those equity losses.  This phase of the safe asset shortage problem is, by far, the most significant, and it is also associated with the sharpest and most persistent decline in real long term interest rates.  But activity in fixed income markets only captures a portion of what has happened.  The ubiquity of comments along the lines of "people forget history and they naively thought real estate never loses value." makes it clear what happened.  There was a public hysteria committed to removing the real estate equity asset class from the set of safe assets.  You may balk at calling it hysteria.  If prices in a few cities like Phoenix had dropped by 20% or 30%, then a defensiveness about that would be merited.  But, when that consensus view is so widely used to excuse and justify a nearly 40% drop in home values in Atlanta, which, like many cities, didn't even see much of a shift in Price/Rent ratios until they collapsed after the crisis, it is quite clearly hysteria.

3) The loss of $2 or $3 trillion more in potential safe assets in the homes that have not been built and the continued suppression of home values in properties that are at or below replacement value because of mortgage market dislocations that prevent households from buying or selling units, especially in low tier markets.

Thursday, June 21, 2018

Upside Down CAPM: Part 5 - Returns on real estate investments

To review: upside down CAPM is the idea that CAPM models should start at the expected rate of return on diversified at-risk capital and the rate of return on risk free savings is the at-risk rate of return minus the premium savers pay for the service of protecting savings for deferred consumption.  Changes in actual returns for at-risk capital come from cyclical changes in profit and from changes in expected long term real returns, but expected real returns at any point in time tend to remain fairly stable at 7-8%.  Fluctuations in real risk free returns come from shifts in the premium savers are willing to pay to avoid risk with deferred consumption.  The equity risk premium doesn't come from changes in expected at-risk returns. It comes mostly from changes in the premium for safety that determines the risk free rate.

This model has led me to realize that I have probably been approaching real estate markets with some misplaced hubris.

Mortgage rates generally follow risk free rates with a small spread, so that mortgages basically fall in the category of low risk saving - deferred consumption.  To the extent that we can measure returns on home equity systematically, real rates of return seem to generally follow risk free rates. Owned home equity is also basically a low risk fixed income security.

But, that doesn't seem to be the case on institutionally owned real estate.  Equity REITs seem to have a fairly stable cap rate and dividend rate.  I had chalked this up to an undeveloped marketplace, where there aren't aggregate market measures that change everyday like in bond markets.  So it seemed like this asset class was like a fixed income asset class, but with a real yield that didn't fluctuate as much.  That didn't seem rational.

However, thinking with an Upside down CAPM framework, having a more stable expected rate of return is a characteristic of equity.  There isn't a mystery here. Institutionally owned real estate is basically a low-beta equity, and it has a low and stable expected rate of return, just as we would expect low beta equity to have.  Its risk comes from cyclical and long term shifts in real returns.

Keep in mind that I am talking about the entire market, so that cap rates are similar to expected returns on all equities, conceptually.  For developers, expected returns on individual projects, or even on all new projects at a given time, may fluctuate more, just as the market for IPOs or private equity seems more volatile and cyclical than the equity market as a whole.

The reason it is more equity-like than owned real estate is because it comes with management costs and vacancies.  This makes net margins lower and more cyclical than owner-occupied real estate.

So owner occupied real estate acts more like low risk fixed income, and the level of debt on a property is mostly related to the owner's need for capital.  Young owners tend to be more leveraged and older owners are less leveraged. Investor owned real estate is like low beta equity and the use of credit is more a product of the market and the property. To the extent that a property can offer the service of safe savings because of relatively certain cash flows, equity holders can optimize profit by using credit as a source of capital.  In fact, market forces will cause profit to be bid down to the point where real estate equity holders have to use credit to achieve a market rate of return.  This is similar to the utilities sector.

This would mean that real long term interest rates would moderate real estate activity between owned and rented properties.  When interest rates are low, at the margin some households would be induced to ownership. There are several ways to think about this. Low real rates reflect demand for low risk savings and deferred consumption. Owner equity serves this function in a way that investor owned equity doesn't. Another way to think about it is to think in terms of cap rates. Cap rates on investor owned properties, being more equity-like, remain stable.  But "cap rates" on owner occupied properties fluctuate with long term real interest rates, so as rates decline, owner-occupied property is worth more than investor-owned property.

It happens that homeownership rates (controlling for age demographics) were high in the late 70s and the 2000s.  In the 70s, inflation (and nominal rates) was high, so rising ownership was explained as an inflation hedge.  In the 2000s, inflation (and nominal rates) was low, so rising ownership was explained as a result of cheap and easy credit.  (Most of the rise in homeownership happened in the late 90s when rates weren't particularly low, so that's not a great explanation.)

Low long term real rates can explain why price/rent ratios were high at both times, but I haven't felt that comfortable explaining why that would lead to higher ownership rates.  Maybe this relationship between owned and rented properties, and the difference between equity and low risk savings, could be part of the explanation for why ownership rates rise when long term real interest rates decline.  (This isn't the case today because housing markets are dominated by credit repression which keeps millions of households out of the market.)

This framework also suggests that multi-unit building should have been much stronger in the 1990s when long term real interest rates were relatively high.  The bias toward equity exposure at the time should have translated to a bias for investor owned real estate.  Maybe some of the increase in homeownership rates in the 1990s was already coming from limits on multi-unit developments in the Closed Access markets, which was blocking this natural shift to rented property when real interest rates were high.

This is all still speculative.  Please provide conceptual or factual criticisms in the comments.

Thursday, August 3, 2017

Ten Years on...

Ten years ago today, Jim Cramer lost it on the air.  It was August 2007, and he was apoplectic about how complacent the Fed was about credit markets.  "They know nothing!", he yelled.

At the time, I thought, "Oh, there go the clowns on CNBC clowning."  I knew nothing.  In hindsight, this - both in content and in tone - was the most prescient public comment of the entire affair.  I give Jim Cramer mad props.  He earned my undying respect.  He was absolutely correct.


Watch the full rant: Cramer's 'They know nothing!' from CNBC.


Meanwhile, the Wall Street Journal was saying this:
Credit panics are never pretty, but their virtue is that they restore some fear and humility to the marketplace....
It's tempting to blame Wall Street and other bankers for all those bad residential loans, and they are paying the price now. But they were also lending into a housing asset bubble fed by easy monetary policy. Risky mortgages always look better when home prices look like they'll never decline. 
Current Fed Chairman Ben Bernanke was along for the Greenspan ride, so he's hardly blameless. No doubt he'd love to play the hero role now, signaling easier money this week.
According to Bernanke, he read the Wall Street Journal article, but purposefully avoided seeing the Cramer segment.

Tuesday, March 22, 2016

Housing: Part 130 - Nominal Shocks, Leverage, and Employment

As I think through the implications of my alternative history of the Great Recession, I keep wondering how much of our collective notions about the causes of economic dislocation are a product of attribution error, hindsight bias, and an ancient discomfort we have with risk, in general (finance being the name we have for mechanisms we have developed for sharing and managing risk).

Inevitably, in a culture and an economy that exists above subsistence, saving is required.  As abundance has grown over time, forms and outlets for saving and investment have become more complex.  For any life more complex than hunting fruits and berries and killing small game, where nature's risks are always at the doorstep, speculation is mandatory.  This is true for even the first steps into agriculture.

In our world, we are all involved in wild speculation.  We have all optimized for a functional society with a complex array of utilities, public institutions, and market provision of highly technical goods.  Frankly, it sort of stresses me out to think about it because we just aren't built to trust the robustness of emergent order, but we all must do just that, to an extreme.  Mostly we cope by not thinking about it.

One of the ways we handle this unavoidable speculation is by engaging in a variety of risk-trading relationships, which, for the most part, settle into a set of social conventions that reflect common preferences, so we don't even think about it consciously most of the time.  Local certainty appears to be very valuable.  Much of finance involves trading local risk.  Equity holders take on short term volatility and both creditors and laborers tend to accept a discount to their incomes in exchange for that certainty.  This is why stocks generally have higher long term returns than bonds.  It is difficult to be tethered to the random walk, both emotionally and as an input in our personal financial plans.

But, there is a necessary trade-off with these risk-trades.  The gains in local certainty to laborers and creditors generally must come at the expense of more risks at the extreme.  Equity is exposed to constant, small-scale local risk, and in extreme conditions may encounter existential risk.  Labor and creditors experience this as a sort of regime shift.  They either exist in a context of relative income certainty or in a context of default or unemployment.

Real estate holds an interesting position here.  Mortgages with stable payments serve this function for both the borrower and the lender.  Homes are real assets - their values change with inflation and with local conditions.  Nominally fixed mortgages make a very poor asset-liability match.  But, what mortgages provide for both the borrower and the lender is cash flow certainty.  We use the general tendency for inflation, and amortization, to essentially push nominal uncertainty off the balance sheet of both the bank and the homeowner.

Note that both labor and creditors basically have made the same risk trade and face the same problems of dislocation when there are nominal spending shocks.  But, isn't it interesting how different our reactions to these two classes of participants are?

Political observers and academics both tend to ascribe the causes of dislocations from nominal shocks to financial leverage.  But, this is a truism.  We are all speculators.  We all optimize to some extent to our general expectations.  One aspect of this optimization will always involve trading short term risk.  If a nominal shock happens that is large enough to cause dislocation, it will, by definition, involve dislocation among these financial relationships that involve the purchase of short term certainty.  To ascribe causality to debtors is equivalent to blaming the grass for a drought.

But, you may respond, some people get complacent and take too much risk.  And those people are the ones that end up being the first dominoes to fall in a crisis.  The causality is right there in front of our eyes to see.  Is there any doubt that the housing crisis was heightened by the concentration of recent homebuyers with high leverage?  Is there any doubt that the crisis would have been less severe with less leverage?  No.  There is no doubt.  As far as it goes, this response is absolutely reasonable.

But, couldn't we also say that the drought would not have been so bad if the grass had deeper roots?  Couldn't we also point to the clever means of water retention that desert plants use and wonder why the grass wasn't doing the same?

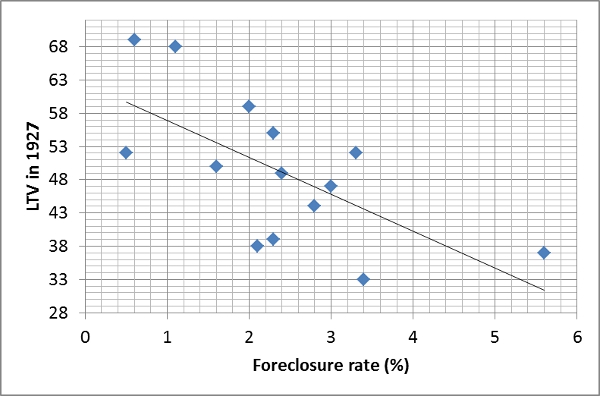
NPV Fig 2My point here is that even if the response is perfectly true, it is also not falsifiable.  Any nominal shock that is strong enough to lead to widespread dislocations will appear to have been caused by leverage.  Here is a post from the London School of Economics that explores the role of real estate speculation in the lead up to the Great Depression (HT: Benjamin Cole).

Here is a graph from the post.  The author, Natacha Postel-Vinay, makes some interesting observations about the real estate market of the time.  In some ways there were parallels to the recent crisis.  In the 1920s, piggyback loans began to gain popularity.  This graph suggests a strange outcome, that in cities with lower 1st lien leverage, foreclosures were higher.  She notes that this is because the lower leverage was associated with the use of piggyback loans, which were more vulnerable to economic stresses.

But, note, loan to values on first mortgages at the time were generally 50% or less.  The cities with the highest foreclosure rates had LTVs under 40%.  And, homeownership rates at the time were under 50%.  Actually, even in the recent crisis, average leverage among homeowners was less than 50% at the peak of the boom in early 2006, though there were certainly cities with concentrations of higher leverage.  So, if neighborhoods with LTVs above 80% or 90% were the cause of the recent crisis, would we have been better with LTVs under 80%, 70%, 60%?  Certainly we would have been less vulnerable to dislocation.  But, when dislocation came, would the story have changed?  If average LTVs in 2006 had been 30% or 40% instead of 45% or if there was a ban on mortgages with LTVs above 90% or 95%, then when dislocation arrived, would we have said, "Well, we can't blame leverage this time."?  Of course not.

And, note what we never claim.  We never apply this prescription to labor.  Even though the consensus among economists is strong that the difficulty for nominal wages to adjust downward is an important factor in episodes of unemployment, there is never an upswelling of academic papers and political candidates after a crisis that complain about our dangerous tendency to have labor contracts with stable wage levels.  We never complain that our unemployment comes from a rigged system where so many laborers recklessly pushed up the operational leverage of firms.  Nobody holds press conferences to complain that fixed-salary workers did this to us and bemoan that none have been prosecuted.

Yet, is there any doubt that if we instituted a law that required all labor contracts pay into a rainy day fund that firms could reclaim during nominal shocks that unemployment would be much less of a problem?  How reckless of us not to do that!  Maybe nominal crises are caused because laborers become complacent when there are long periods of stability.  Maybe appropriate public policy should aim to allow frequent employment shocks so laborers don't get complacent.

Funny how that sounds wrong, even though it is basically the same proscription that is seriously offered in the financial realm.  Operating leverage and financial leverage are both leverage.

Is there a façade of empiricism here?  Do our shared notions about the causes of economic shocks exist in a plane above and disconnected from empiricism?  Are we simply projecting our human biases in a subconsciously predetermined narrative?

If leverage is dangerous, the way to reduce it over the long term isn't through cyclical second-guessing.  Corporate leverage has actually been very low going into the last two contractions.  The reason leverage in general, by some measures, was too high was because low interest rates and supply constraints in housing had increased the value of homes.  But, low long term interest rates are hardly a sign of speculative fervor.

Source
If leverage is dangerous, we can easily reduce the advantages that debt gains through tax and public policy.  To reduce leverage in housing, we have to start building homes in high value locations.  These are structural issues.  To solve this cyclically is a public policy minefield, and simply diverts attention from policies that could provide nominal stability.  As much gnashing of teeth as their has been about bailouts and excess in the recent crisis, this was a perfect example of a crisis where we introduced extreme nominal instability because we were so concerned about debt.  And, since the cause of the crisis was predetermined, when we introduced instability, we still all agreed to blame that debt.

There were observers complaining about housing bubbles as early as 2001 or 2002.  But, even when the crisis hit, aggregate home prices never fell below the prices of 2003.  Suppose we had introduced enough nominal instability in 2003 to cause home prices then to fall back to 2001 prices.  Would the story have changed?  Millions of mortgages originated in 2003 and 2004 had low default rates.  But, in this scenario, many would have defaulted.  Is there any question about where the blame for the instability would have been laid?  There is no question.  We would have blamed debt and speculation.  Yet, we know that there was nothing wrong with those mortgages.  They have performed quite well, even though those 2004 cohorts have dealt with volatility unheard of since the Great Depression.

Monday, February 15, 2016

Eurodollar Futures

I thought it was time to put my rate hike estimating tool to bed, but it looks like I'm back in business.

Here is what the curvature of the Eurodollars futures market is saying about future rate movements.

The next expected rate hike has dropped back to late 2017, but it is moving around a lot.  There is a lot of uncertainty.  The previous rate hike certainly did help meet the Fed's goal of keeping risk premiums high.  Macroprudence!

Coming movements in the yield curve should be telling.  Right now, I would say that the yield curve is close to being inverted, if we adjust for distortions from the zero lower bound.  But, it's not too late.  A reversal in the rate hike would be the least I would hope to expect in a sane world.  But, maybe we can move forward in any case, depending on how things develop.

In this second graph, we can see that the length of time between now and the expected next rate hike has spiked, but it isn't as long as the length of time that was expected before and during QE3.  If the yield curve flattens more, I don't expect things to turn out well.  But, maybe there is a chance that positive real economic growth can manage to salvage normalcy.  Of course, as always, mortgage expansion would solve all of this much more effectively than marginal rate changes.

(The gaps in the graphs reflect the period where the model was dormant because the curvature of the yield curve at the short end had disappeared.)

Tuesday, February 9, 2016

Another Brief Note on the Yield Curve

Saw this on twitter today:
Here is the CME Group interactive Fed Watch tool.  These models show that yesterday, the odds of a rate hike at all in 2016 were about 35%.  That has fallen to about 25% today.  My model, which is based on the curvature of the yield curve showed a mean expected rate hike date in August, yesterday.  But today, that has moved all the way back to May 2017, with a slope after that which is still about 8 or 9 basis points per quarter.

I use Excel Solver to do the estimate, and, interestingly, Solver seems to have more than one optimal answer on the yield curve data from yesterday and today.  One answer is the August and May inflection points.  The other answer is basically that the next rate hike is highly uncertain, and far in the future.  Since expectations of remaining at zero do not affect the inflection point, because there is no inflection point in that case, I think my model is giving a different answer than the models that are based on rate levels.  I think the correct way to read all of this is that about 1/3 of the market thinks rates will rise, with a mean date of next May, and it will rise by about 25 basis points per quarter.  The other 2/3 of the market thinks rates will not rise at all.

The biggest red flag here is that, as far as I can tell, there is apparently zero expectation of a possible retrenchment.  The clear response right now would be to take a do-over and move rates back to near zero.  And there is no expectation of that happening at all, that I can tell.

The populists and Austrians think this is just proof that we have a bubble economy that can't grow without monetary stimulus.  They seem to like it when this happens, as if the S&P 500 at 2100 was fake and it is only real at 1850, or maybe 1600, or maybe less.  We've got a case of national Munchausen Syndrome.

Don't even worry about suggesting some optimal monetary policy.  Just give me a policy that isn't vulnerable to explicit communal self-immolation.

Monday, February 8, 2016

The Yield Curve Curves Again

Last summer, the then-future rate hike was moving ahead in time, always 6 months in the future.  Until we revive the mortgage credit market and the single family homebuilder market, that may be the best we can hope for.  Where is capital supposed to go if we effectively obstruct trillions of dollars of potential investment?

As we moved through 2015, the Fed decided to impose a rate hike, and so, finally, the expected date of the rate hike became anchored in time, and we finally caught up to it in December.  Since then, the yield curve has flattened sharply.  In fact, we may be near the equivalent of an inverted yield curve now, with forward rates boosted by distortions of the zero lower bound.

In the most recent rate hike periods, rates have risen by about 50 to 70 basis points per quarter. During QE3, the slope implied future rising rates of only about 15 to 35 basis points per quarter.  I suspect this partly reflected expectations of slower rises and partly reflected expectations that we would not leave the zero lower bound.

Now that the Fed hiked rates, the slope has declined all the way to about 8 or 9 basis points per quarter.  There is also a lot of uncertainty about the date of future rate hikes.  This is so low that I think it reflects a very strong expectation that rate hikes will never come.  Long term rates in Japan were in the 2% range until recently during a long period of low short term rates.  This is basically a flat yield curve.

The fact that there isn't a unanimous call for the immediate reversal of the rate hike is pretty much the picture of our dysfunctional era.  We know what we want, "and deserve to get it good and hard."

In the meantime, the short end of the yield curve now curves up yet again.  And, we are back to a context where the next future rate hike is expected to be about 6 months in the future.  Probably the best we can hope for is that we are back in the context of the ever-moving rate hike, always 6 months in the future.  If we ever start building homes again, maybe it can rise naturally.  Until then, if the Fed decides to continue to pretend it controls short term rates in some sort of Phillips Curve fantasy, then they will push us over the edge again.  This time, though, it won't be preceded by a housing collapse or a tepid, but manageable NGDP growth path, because there is little housing market to ruin and NGDP growth is already tepid.  We basically are already back to 2007, where wage growth is strong, but is all being eaten up by rising rents.  I don't see any reason to think we can't walk right back into a 2008 situation, given public and FOMC viewpoints.