Showing posts with label Employment. Show all posts

Wednesday, May 29, 2019

Uber and wages in a free economy.

Here was a recent article about Uber and Lyft drivers in Washington, DC, colluding to game surge pricing at the airport.
Every night, several times a night, Uber and Lyft drivers at Reagan National Airport simultaneously turn off their ride share apps for a minute or two to trick the app into thinking there are no drivers available---creating a price surge. When the fare goes high enough, the drivers turn their apps back on and lock into the higher fare.
It's happening in the Uber and Lyft parking lot outside Reagan National airport. The lot fills with 120 to 150 drivers sometimes for hours, waiting for the busy evening rush. And nearly all the drivers have one complaint:
“Uber doesn’t pay us enough, what the company is doing is defrauding all these people by taking 35-40 percent,” one driver told ABC 7.
There is a lot going on here.  Really, these drivers aren't colluding against Uber and Lyft.  They are colluding against the customers, who must pay surge pricing.  Uber and Lyft must compete against each other for riders, which drives their fares down to the competitive level.  The drivers are actually colluding so that they and the firms can claim monopoly profits from airport customers.

Their complaints are against the firms, but really, the culprit is competition, which prevents both them and the firms from boosting their incomes at the expense of riders.

In fact, their complaint against the firms is even more misguided than that.  The firms are charging riders a competitive rate and they are overpaying the drivers.  This is a classic economic problem.  There is a queue at the airport.  Those drivers are choosing to go sit in line at the airport instead of driving around the rest of the city picking up riders on the go.  And the reason is that, at standard rates, airport rides are more lucrative for them.  The reason for a queue, conceptually and in this particular case, is that the price is too high.

If the price was too low, you would have a queue of customers, like during the oil shocks of the 1970s when price controls were put in place.  Here, the price Lyft and Uber pay to the drivers at the airport is too high, so the producers (the drivers) are queuing.

Paying drivers more would only make this problem worse.  If they are waiting for an hour to get a fare now, then if the typical fare doubled, drivers would wait for two hours.  Uber and Lyft aren't determining the hourly wage for these drivers.  They are determining it by deciding to wait in line.

The only other way for Uber and Lyft to solve this problem would be to ration the supply of drivers in some other way.  In a way, this is one reason drivers might want to be classified as employees instead of contractors.  If Uber and Lyft treated drivers like employees, they would manage how many drivers there were and where they drove.  They could eliminate the queuing, which would raise wages and reduce the waste of queuing, but it could only happen by being a gatekeeper.  The only way to get rid of the queue would be to tell some of the potential, qualified drivers that they aren't invited any more.  They aren't "hired".

This is similar to the issue of minimum wages.  The way this raises the wages of some is by eliminating the wages of others.

That isn't all bad.  Here, it would lead to less waste by eliminating over-long queues.  But, small scale gains due to monopoly power or economic rents don't add up to social gains.  Everyone can't earn more than the competitive income by using market power to impose exclusion.

The queue is wasteful, but I'm not sure there is a solution.  The economics of driving basically will always come down to queuing.  Whatever rate Lyft and Uber pay, whether drivers are sitting at the airport, or driving around town, the economic breakeven for the drivers will be a function of queuing in some way.  It will determine when and where they drive.  In any given part of town, how long do they need to wait to get a rider, how long do they need to drive to pick up the rider, and how long will the average ride be?  That equation comes down to how much time is a rider in the car versus how much time is the car empty.  There are several supply and demand variables that lead to an equilibrium level for any particular location, but in the end, that equilibrium will be driven by the willingness of drivers to queue in order to get a fare and it seems that some queue, such that it is, will remain wherever Uber and Lyft set their fares and their driver reimbursement levels.  Limiting the number of drivers at the airport queue, where the extra 50 or 100 cars in line has little effect on the quality of service, may seem like a no-brainer.  But, trying to reduce queuing out in the marginal markets around a city will change the supply and demand dynamic in a way that will lead to deadweight loss on the margin.  Reducing the number of drivers will necessarily increase wait times for riders, changing demand for drivers.

I am sure there are teams of economists working on this problem at Uber and Lyft.  I suspect they don't so much mind being tricked into surge pricing at the airport.  They certainly aren't going to raise driver payments in an attempt to address the issue.

Monday, April 8, 2019

Real Phillps Curve Update

Here are a couple of charts comparing real wage growth and unemployment.  My contention is that the Phillips Curve is real, not inflationary.  It only appears to be inflationary when monetary policy is procyclical.  When unemployment is low, real wage growth is higher, largely because of better matching, fewer frictions in labor markets, and higher labor productivity.

If we treat the Phillips Curve as nominal, then the inclination is to reduce growth to prevent inflation, and unemployment will be invariably driven higher in a misguided attempt at moderation.

If we treat the Phillips Curve as real, then the inclination is to celebrate low unemployment unconditionally, and allow the benefits of highly functional markets to continue to accrue.

There is a relatively stationary long term relationship between real wage growth (I prefer using CPI less food, energy, and shelter as the deflator) and the unemployment rate.

We shouldn't be afraid of real wage growth.  And, in either case, wage growth is humming along pretty close to the long-term trend.  Celebtrate that unconditionally.

Tuesday, September 25, 2018

Housing: Part 323: Construction Employment during the crisis

I have dug into employment numbers a bit, and I think there are some interesting things here.

What happened?  A reasonable person might say this: There was overbuilding by the end of 2005.  This required a shift out of construction employment as the housing bubble wound down.  Federal officials underestimated how much the housing correction would bleed into the rest of the economy.  Eventually the collapse of the construction market in the bubble cities metastasized and caused employment and consumption to contract more broadly.

As I have so often found, the truth may be closer to the opposite of that.

Here, I am using state data, and I am using two independent variables to describe each state.  The first variable is the level of construction employment in December 2003 as a percentage of total state employment.


Construction as % of Total Employment: higher vs lower construction states
Here is a graph of construction employment as a percentage of total, over time, for states that had construction employment one standard deviation above or below normal in 2003.  There are several interesting points here.

(1)  States with high construction employment in 2003 are states that typically had high construction employment in the past(in other words, building lots of homes and growing).  And, notice that from the end of 2003 to early 2006, states with less construction employment continued to have flat construction employment but construction employment in the high construction states went higher. This supports the idea that the housing boom was just an acceleration of longstanding patterns of migration.

(2) When the CDO panic hit in the summer of 2007 and the recession officially started in December 2007, construction employment was still near the peak of the boom.  There was no re-sorting out of construction into other forms of employment before the recession.  Then, during the first year of the recession, construction employment did start to drop somewhat in the growing states.  But, it was only after the financial crisis that construction employment saw its steepest decline.  The recession caused the contraction in construction employment.  Construction continues to run below the pre-boom levels in the states that had previously been high construction/high growth states.

1 Year Change in Total Employment, by State
But, interestingly, there was a contraction that preceded the recession in total employment growth in high growth states.  It's just that that contraction was not focused on construction employment.  It was a general contraction.  And it was sharp.  Employment growth in states that had low construction employment continued along at its (low) flat rate of just under 1% annually.

So, there was an employment slowdown in the states that had been building a lot of houses, but it wasn't a slowdown in construction employment - even though housing starts were dropping sharply.

Also, this graph shows that there was an especially wide gap in employment growth in 2004-2006 between high construction and low construction states, but, compared to the 1990s, the gap wasn't wider because the high growth states were growing more.  It was wider because the low growth states were growing less.


Construction employment as % of total: bubble and non-bubble states
The second independent variable I used was the change in construction employment from December 2003 to March 2006 after accounting for the correlation between the pre-existing level of construction employment and rising construction employment that is visible in the first graph.  In other words, the first independent variable is a measure of persistent migration patterns and the second independent variable is a measure of "bubble" activity from 2003-2006.

The pattern is similar during the boom and early crisis.  Construction employment peaked in 2006 and remained relatively high until the recession began, then started to decline, and especially declined after the financial crisis.

But, notice the difference after the crisis.  The "bubble" states - states that had unusual growth of construction employment during the boom - never saw construction employment contract below the level of construction employment in non-bubble states, and then recovered more strongly after the recession, so that now, they are back near the construction levels of 1996-2003.

So, the states that had accommodated persistent in-migration for decades have been permanently hobbled by the housing bust (They continue to have higher construction employment than other states, but not as high as they previously had.), while the states that actually had unusual construction employment growth during the boom continue to have unusual construction employment growth compared to other states.


As with other data, this suggests that we didn't bust a housing bubble.  Instead, there was an acceleration of long-standing migration patterns, and those migration patterns have been hampered by a crippled housing market.

Unemployment rate: high vs. low construction states
There is a similar pattern in the unemployment rate among states.  The unemployment rate was lower in both the long-term growth states and the bubble states until mid-2008, then the unemployment rate in all states rose together through 2009, regardless of their previous construction employment levels.  As shown above, it was then that construction employment really collapsed.  In the bubble states (the states with unusual construction employment growth from 2003-2006, not shown in this chart) the unemployment rate continued to move in line with other states.  But, in the states where there had been long-term high levels of construction employment, the time period where their unemployment rates were especially high was 2010 through 2012.

This last graph is of the unemployment rate for the states that had construction employment one standard deviation above and below average in 2003.  And, here I have added a hypothetical state with zero construction employment, which I think gives an interesting baseline for thinking about construction and non-construction employment before, during, and after the crisis.

The crackdown on lending in 2008 and after, and the consensus view that new construction was problematic were the primary causes of dislocation.  Imagine if construction employment in high growth states had managed to bottom out at even 5.5% of total employment in 2009 and recovered from there.  Or, if it had recovered more quickly, as it had in the 1990s (which wasn't exactly a building boom decade, itself).

I am hoping to get a chance to look more thoroughly at this, but in the meantime, this seemed worth sharing.

Friday, May 4, 2018

April 2018 Employment Flows

Employment flows sure don't show any signs of weakness, either in gross or net terms.  Healthy flows from not-in-labor-force to employed, from unemployed to employed, etc.  Everything looks good.

No signs here of imminent contraction.

I have been prematurely looking for contraction from an overly hawkish Fed, but there certainly isn't much in labor markets to confirm that position.

Of course, labor markets tend to be lagging or coincident indicators, while equities and the yield curve tend to be more leading indicators.  But, things are looking good here.

Friday, April 27, 2018

Wage pressure is not inflationary.

The employment cost index for the first quarter continues to show some moderate strength.  This has led to new discussion about inflation, etc.

I have written a few posts about the Phillips Curve - the idea that wage growth and inflation are related, or that rising wages lead to rising inflation.  I don't think this relationship works the way it is generally described.  Monetary inflation should certainly cause wages to rise just as it should cause all price levels to rise.  Clearly there is causation going in that direction.  I think the apparent causation going in the other direction is misleading.  It is a matter of only feeling parts of the elephant.

One main piece of evidence that makes it look like rising wages lead to inflation is that firms report tight profit margins that are being squeezed by rising wages.  They either have to raise prices or reduce profits.  It seems likely that this would produce price pressure.  The idea of cost-push inflation is alluring, but not useful.

First, there are two potential sources of wage pressure.

1) Rising capacity utilization.

2) Fundamental productivity growth.

On point 1, as unemployed workers return to the labor force and the pool of potential workers declines, there are pressures on wages.  But, an economy running below capacity is not a productive economy.  In this context, both wages and profits should rise, but this should be more than compensated for by the boost in productivity caused by utilizing productive capacity.  Wage and profit growth should be real, in this context.  If anything, this sort of growth should be disinflationary as real growth would be strong.

On point 2, it is difficult to grasp in real time the full complement of mechanisms that are in play.  And, we will be more likely to see ailing, dying industries that we are familiar with than new, disruptive industries that are the source of new productivity.  Here, also, it will appear that rising wages are inflationary, but they are not.

Here, it might be useful to think of Amazon vs. brick and mortar book stores.  Wage growth was strong in the late 1990s, and it would have been tempting to look at rising wages at brick and mortar book stores, and to forecast inflation.  That is because those were mature businesses, so they had a very stable and understandable cost structure.  Wages were rising, and they either had to raise prices or lose profits.

But, what we were seeing there wasn't price pressure.  What we were seeing was productive transformation in an economy.  What we were seeing was the end of a business model that wasn't profitable any more.  When any business model comes to the end of its life because of new innovation and productivity, it will look like it is suffering from cost pressures.   But, to the extent that those cost pressures were acute, they simply led to the transformation to new, more productive business models.

Amazon, on the other hand, was hiring like mad.  And, nobody was looking at Amazon as a source of inflationary wages.  That's funny, really.  Because, since Amazon was young, they were not particularly profitable themselves.  But, nobody looks at a young, disruptive company and says, "Oh, labor costs are cutting into their profits, this could lead to inflation."  That's because Amazon wasn't trying to become profitable by cutting costs.  They were trying to become profitable by hiring and growing.

There was a lot of that going on in the late 1990s.  So, profits were low, wages were growing, and inflation was moderating.  And, the stock market didn't seem too put out by the whole state of affairs.

By the way, interest rates were also high at the time, but they weren't high because the Federal Reserve was trying to discipline risk-takers by sucking cash out of the economy.  They were high because investors were risk-takers, and so the safety of fixed income was not highly valued at the time.  The appetite for risk wasn't expressed through borrowing.  It was expressed through Amazon's rising stock price.  It was expressed through expanding equity, not debt.

Rising wages are a sign of progress.  They are something to be encouraged, not tempered.  When wage growth is strong, real interest rates might naturally rise, but there is no reason to try to force them to in order to stop the business cycle.

Wednesday, January 10, 2018

Housing: Part 276 - No, the Contagion cities aren't in better shape today.

Bill McBride, at Calculated Risk, has a post up about economic growth in the bubble cities (HT: Daniel Miller).  McBride points out that unemployment rates are low in cities like Riverside, CA.  And, since their economies are less dependent on construction and building now, their recovery is on more solid ground.

I think this is a good example - one of many - of how the notion that the bubble was the anomaly and the bust was a return to normalcy, shades one's viewpoint about what is happening in the economy in general in a way that diverts focus from important issues.

Now, first, I would say that the ideal world would be one where Los Angeles and San Francisco were growing instead of Riverside and Phoenix.  Really, what we have here (and I say this as a happy resident of the Phoenix area) are cities that are inferior substitutions for cities where residents would rather live.  The growth of Phoenix and Riverside is largely the product of a post-industrial refugee crisis, as financially constrained households are forced out of cities with limited housing options.

But, given the world we have, cities like Phoenix and Riverside should absolutely be growing, and it would be appropriate, right, and healthy for their economic growth to be dependent on construction.  In truth, even without the Closed Access refugee problem, Phoenix would likely have strong migration in-flows from the Midwest and the North.  But, certainly, in an economy with an unencumbered financial sector and coastal housing shortages, these cities today would be growing at their practical limits.

This is where unemployment rates can be a bit misleading.  In cities where economic expansion is manifest in migration, it is primarily migration shifts that adjust to changing conditions.  This is why the recession beginning in December 2007 is dated so long after the Federal Reserve had initiated policies that were too contractionary.  Employment growth had started to turn south at the end of 2006, but this didn't lead to much of a rise in unemployment rates, because at the time, hundreds of thousands of households were flooding out of Closed Access cities to escape their rising costs.  So, the first thing that happened was that the migration flows abruptly stopped in 2007.

It was only after this first adjustment in migration patterns that unemployment started to rise.  Here is a graph of LA & Phoenix employment (indexed for comparison) and the unemployment rate.

Source
In the 2001 recession, when employment growth stalled, the unemployment rate rose in both cities.  But, notice what happened in 2006.  There was a downtrend in employment growth in both cities, and that continued until 2008, when employment dropped disastrously in both cities.  (As an aside, this chart is one of many that makes me shake my head at the pressure the Fed was taking in September 2008 not to stabilize the economy.  For Goodness' sake.)  Notice two other things, too:

1) Employment levels held on longer in LA than in Phoenix.  Phoenix employment really started to fall at the end of 2007, after the subprime market crashed.  LA held on until the September 2008 debacle.  Previously, about 2% of Los Angeles' population had been moving away each year, many of them to Phoenix, but this mostly stopped by 2008.

2) In August 2006, the unemployment rate in Phoenix was 3.6%.  In LA it was 4.4%.  A year later, in Phoenix it was down to 3.1% and in LA it was up to 4.8%.  We can see the effect of the whipsaw in migration in the unemployment rates.

By many measures, one could reasonably argue that a weak recession had begun by the middle of 2006.

Now, back to Bill McBride's comments, we can see the damage that the housing bust did to the Contagion cities more clearly in population and income levels than in the unemployment rate.  And, the economy since 2005 has not been kind to them.

Source
Here is a graph of personal income per capita (indexed to 2005 at the peak of the housing boom).  Before the Great Recession, incomes across cities of all types correlated reasonably well with one another.  But, when the housing bust hit, and was enforced, the damage was targeted at the cities which had previously been both aspirational destinations for Americans from the interior, and a release valve for Closed Access refugees.

LA is in black.  The Contagion cities are in orange tones.  Other cities are in blue tones.  The damage has especially hit the Contagion cities.

Source
We can see the effect in population growth, too.  Here is a similar graph, showing the Civilian Labor Force for each MSA (indexed to the end of 2007, when the housing bust and the recession had eliminated net in-migration).  The Contagion cities were fast growers during and well before the housing boom.  In fact, in spite of the errant claims that they had overbuilt during the boom, their growth rates didn't change that much during that period.

But, they changed drastically with the bust.  (Much of the deviation after the bust, in the graph, is from 2010 Census revisions, but we can see that the trends across all cities were fairly flat.  Only recently have labor force growth rates picked up somewhat in those cities.

What would be great would be if LA managed to grow again.  But, lacking that, healing will come with growth in the Contagion cities.  And, the causation isn't that we need to build homes to boost spending.  (Well, first and foremost, we need to build homes because they provide shelter and access to urban amenities!)  The causation is that a functional, healed economy will manifest itself in a return to old patterns - migration, homeownership, incomes that moderate between various cities.

But, for now - no.  These cities aren't in better shape today.

Friday, December 8, 2017

November Employment Flows

I have been on the lookout for a bit of a contraction because of Fed hawkishness, stalled credit growth, etc.  So far, this has not come about.  Strangely, bank lending seems to have stalled at about the time of the 2016 election, but at the same time, at least initially, the yield curve steepened, which should be a bullish sign, and of course equities have shown healthy growth.

Employment tends to be a lagging indicator, so it isn't necessarily that useful for making tactical cyclical decisions, but in the year since the election, employment flows have also been surprising.  Both in net terms and in gross terms, they have taken bullish turns.

Near the end of 2016, net flows from Unemployment to Employment had been showing weakness, but this has completely reversed, and now net flows from unemployed to employed are back to recovery levels.

And, gross flows were all turning sour in late 2016.  Flows between Employment and "Not in Labor Force" had started to decline in both directions, which is bearish.  And flows between Unemployed and "Not in Labor Force" and Unemployed and Employed had both stopped declining, which also tends to happen during contractions.  But, these flows have also reverted to bullish trends.

Go figure.

The Fed seems intent on sucking cash out of the economy while the CFPB continues to enforce capital repression on working class home buyers.  Yet, there appears to be some loosening of credit, possibly simply from the continued rebuilding of equity, and low-end housing is finally recovering at a rate similar to high-end homes.  There is a lot of catching up to do there, though, if we will ever stand for it.  Are there enough tailwinds to keep this thing going?  I hope.  With so many contradictions, it's tough to be a speculator in this context, though.

Wednesday, August 23, 2017

More on the "Real Growth" Phillips Curve

I have been trying to build a case for a "real growth" Phillips Curve, where low unemployment leads to rising wages.  Normally, this is associated with rising inflation or with rising labor share of national income.  But I think it mainly equates with higher real growth.  (I think there is a case to be made for labor share of domestic income rising during extended periods of stability.  But, I think this has more to do with capital requiring a lower risk premium than it has to do with things like negotiating power.)

Conor Sen has been noting on Twitter how restaurant margins are getting squeezed by rising labor costs.  It looks like what we have here is a battle between inflationary or labor share versions of the Phillips Curve.  Either restaurants will raise prices and stay in business or they can't raise prices, and their profits will suffer.

But, if we think one more step here, we can see that this is economic growth.  This is sorting.  Wages are rising because workers have better things to do.  In other words, the economy has moved to a new regime where more value can be added somewhere than could be added in the restaurant that used that labor in yesterday's economy.

Sen notes: "We have too many restaurants and a lot are going to close over labor costs and an inability to raise prices."

What will happen, if growth continues, is that the better restaurants will have pricing power, the worst restaurants won't.  Or, more generally, the weaker firms will naturally be the firms that fail.  There will remain a restaurant sector of some size, where wages will be higher and profits will remain at normal sustainable levels.

Interestingly, restaurant employment is growing as a proportion of total employment.  So, this may not even require a contraction in the industry itself.  Weak firms might be forced out by shrinking margins, even as the category remains healthy.

This is creative destruction.  And, we can see quite clearly that this is happening during an expansion.  It is happening because of expansion.  This is the sort of pressure that we need to apply to weak firms in the restaurant industry.

A contraction would also cause weak firms to fail.  But, why would we choose that?

It seems to me that many people see rising wages and they expect that to be inflationary, so they decide that this is unsustainable, and a contraction will pull us back down to earth.  Then, on the other hand, some employers see rising wages and they find their profits being squeezed - in other words, it's not inflationary.  And, they decide that this is unsustainable, and we need a contraction that will pull us back down to earth.

What is really happening is that wages are rising, and this is unsustainable.  We are approaching a better tomorrow.  It is unsustainable in the same way that blacksmithing, film developing, and candlemaking were unsustainable in the past.  Our reaction should be, "This is unsustainable.  Let's keep it up!"

Sunday, August 6, 2017

Growth means change, and change is hard.

Today, I would like to draw on a couple of recent posts.  One was on our tendency to interpret events based on what I think Tyler Cowen would call "mood affiliation".  In that post, I note that journalist Matt Taibbi seems to be certain that the GSEs performed terribly because management teams were persistently corrupt and incompetent at both firms (even with a purge of executives at each firm!) and seems to be equally certain that the exceptional performance of the GSEs during the housing bust shows that affordable housing targets didn't lead to any of their problems.  There is an axiom here: redistributional public programs don't fail.  Management fails.  This axiom remains true, even if both factors must define the results of a single institution.

Now, to be fair, it seems to me that much of the damage of the housing bust was the result of the opposite axiom, that public programs fail.  This led to many public policy postures and implementations meant to counter supposed effects of the GSEs that, frankly, to me, seem to either wholly contradict the facts or to use facts that bear little resemblance to reality.  For instance: the frequently repeated complaints that the GSEs represent a subsidy to housing that pumps up the market and fed the bubble.  This has both factual and conceptual problems.  Compared to things like tax subsidies, the GSEs have a miniscule effect on home prices.  And, they were a countercyclical force during the housing boom and bust, if anything - at least until the feds took them over.

What everyone can agree on, it seems, is that management is corrupt and incompetent.  The GSEs had four sets of executives that were each dragged over the coals for allegations that were remarkably correlated with public mania over time.  I've pointed out before that as management at both firms was being accused of hiding their credit risk in late 2007, the previous two CEOs were settling the cases against them from several years earlier for managing earnings, which included the sin of over-reporting their credit losses.  In both cases, though, we could count on a basic national consensus that the executives were greedy and corrupt, so it was easy to form a consensus on some form of liquidationism.  Bastards had it comin', after all.  So, we sort of did the nationwide version of urban rebellions.  We burned our collective Main Street down until we felt confident that Wall Street felt our pain, and we consoled ourselves that it was their fault that we had to do it.

----------------

The other recent post was about the Phillips Curve.  We tend to think of the Phillips Curve as a sort of measure of the negotiating power of workers.  When unemployment is low, they can hold out for higher wages.  If one thinks this leads to inflation, then one believes that firms have pricing power, and the higher wages just come out of the pockets of consumers, leading to a sort of zero sum outcome.  If one believes that firms don't have pricing power, then the higher wages come out of profits, leading to a gain for workers at the expense of firms.

I don't think either of these forces are particularly strong.  I think the primary force is about sorting.  At low unemployment, workers can have more confidence about trying out new sources of income.  And, for that matter, so do firms and investors.  Wage growth does tend to be strong when unemployment is low, but this isn't paid for by consumers or by firms.  It's paid for by growth.

So, how do these things fit together?

-------------------

Well, when unemployment gets low, managers tend to complain about a lack of available workers.  As a reaction, you see a lot of commentary about how those (incompetent or stubborn or dishonest) managers are short sighted and/or ignorant of economics, and if they would just pay the market rate, they wouldn't have any problem finding workers.  The problem is that they are being stingy.

While I have been drawn into that sort of thinking myself, I think there is some justification for the posture of those managers.  Probably a good manager has to be careful about buying into a boom of cyclically overpriced labor.  Certainly, if we are going to demand the heads of, say, homebuilders and bankers, for "dancing while the music plays", we can't really also complain that they aren't outbidding each other for new production in an aging expansion.

We get to play that game because in the realm of "mood affiliation", few are looking for ways to bolster the status of managers.  So, they are always available as "the reason" why things aren't working out.  Ask anyone why the US auto firms lost domestic market share.  I bet most of them will say it was the mistakes management made in the 70s or 80s.  You and Matt Taibbi will never be disinvited from a cocktail party or fired from Rolling Stone for staking out that position.

But, I think if we really think about what is going on in the labor market there is more going on than just managers avoiding commitments that have costs that have been cyclically distorted.  I think we are actually seeing those secular shifts that lead to real growth - those laborers who aren't using negotiating power to demand a marginally higher wage, but are using it to shift to new sectors and new opportunities.

Here I need to walk back some complaints I have made in the past about pundits who claim that employers hope for recessions in order to get the upper hand on labor.  I won't walk it back too much, because, in the aggregate, clearly it is employers who are hurt far worse in downturns than laborers are.  Profits drop by something like 8% to 10% for every 1% drop in wages.  Unemployment and falling wages are really mostly a side effect of how much equity is hurting.

But, I must admit, I see how they can get that impression.  There are employers who will suggest that a little downturn could be useful.  This is horrible.  I can't believe in the 21st century, where we spend more than a decade in full-time education, this sort of nonsense can pass.  But, I can see why they feel that way.  The reason is that Growth means Change!  It's the same reason why all forms of material and spiritual improvement are met with resistance.  If you have some stake in the status of today's moral or physical world, then improvement is a threat.  Creative destruction is destruction, after all.

The reason some employers wonder if a downturn could help - the reason some employers complain that good workers aren't available at reasonable wages - is because in a humming economy, permanent growth - permanent change - is in motion.  For practically any firm that occupied some little corner of yesterday's economy, in this context, that little corner is bound to shrink.  It will comprise a smaller portion of the ever-evolving aggregate basket of goods and services.

So, we shouldn't snark about how those employers are stingy or how they don't know their economics.  We should pity them, because really what is happening is that we are winning - we, as in the emergent collective of a free people in a free economy.  We are winning, and that has to come at their expense.  We're all blind men feeling the elephant, and their part of the elephant, on the margin, is atrophying as the elephant morphs into something new and unimaginably better.  We, the collective, are winning, and they, individually, on the margin, must lose.

Would blacksmiths or film developers or candle makers have saved themselves if during the relentless march to a better material world they had simply raised their wages enough to keep drawing workers in from the auto factories, the digital imaging firms, or the incandescent bulb manufacturers?  Those complaining employers aren't necessarily going the way of film developers tomorrow.  But, on the margin, I think it is this process that they are noticing.  It is painful to them.  And, in spite of that, it is everything right with the world.

Among the countless things I see that seem backwards, one of the big ones is this horrible idea that recessions do some good by squeezing out the "weak hands".  My goodness, that is a toxic idea.  You know what squeezes out the weak hands?  Expansion!  Growth!  You think we don't use many blacksmiths anymore because we wisely imposed recessions on them?!  NO!  The blacksmiths went away because of growth!  Now, I wouldn't be surprised if most of those blacksmiths, individually, actually failed during, and in some immediate sense, because of, economic contractions.  But, can you see how wrong it would be to argue that progress came from the recessions?

The next time you see an employer complaining about tight labor markets, tell them, "My condolences, friend!  What wonderful news!"

Tuesday, July 11, 2017

The Phillips Curve is real.

There are many subtle ways in which we have an intuition to think in terms of competing factions instead of cooperating factions.  Generally, where labor and capital are not artificially constrained, our interests are much more aligned than otherwise.

I think this is partly why the Phillips Curve idea is so persistent.  There is this idea that when the economy is growing and unemployment is low, this will lead to inflation, because workers will be able to demand higher wages from employers.

Of course, the problem is that this hasn't shown up in the data for decades.  Some argue that the Phillips Curve is now flat because the Federal Reserve targets a level inflation rate.  That's certainly true.  I would argue that the Phillips Curve is a measure of monetary policy.  If the monetary regime is pro-cyclical, the Phillips Curve will tilt down.

That is in nominal terms.

In real terms, there does seem to be a persistent Phillips Curve that slopes down.  Wages were unusually high in 2008-2009, but generally, before and after the recession, real wage growth and unemployment have moved within a long term relationship.  Real wage growth is a little low, but it has generally moved up the trendline since the bottom of the recession as unemployment has declined.

I noticed that John Hussman beat me to this.  His post from April 2011 has some interesting details about it.  His take on it is that the nominal Phillips Curve is wrong, and on top of that, even if it was operational, the Fed has the causality backwards.  Inflation won't lead to less unemployment.  If anything, less unemployment would lead to inflation.  But, even that is wrong.

The funny thing is that his point in 2011 was that inflation wasn't going to be helpful.  He thought the Fed was too loose and asset prices were too high.  And he didn't want them to keep policy loose in a quest to lower unemployment.  I would say that this point of view has not aged well.  There was a brief dip in the stock market in 2011, but in the six years since that post, total returns on stocks have averaged more than 10% annually and inflation has remained subdued.

I think he has some great points about the Phillips Curve, but I would argue that this is why the Fed shouldn't worry about tightening today.  Low unemployment won't lead to inflation.  I think we can both be right, here, though.  In either case, tightening or loosening, a Phillips Curve justification seems wrong.

Source
I do have a quibble with Hussman - maybe a speculative quibble, but a quibble nonetheless.  He basically makes a supply and demand argument: "very simply, when a useful resource becomes scarce, its price tends to increase relative to the prices of other goods and services."  So, this still has a lot in common with the basic intuition of the Phillips Curve.  These higher wages are coming from a position of negotiating strength.  A nominal Phillips Curve would suggest that those higher wages are being paid for by consumers through higher prices.  A real Phillips Curve suggests that those higher wages are being paid for by employers.  Viewed as a proportion of income, it certainly appears that there is a trade-off between labor compensation and profits.

But, this inverse relationship doesn't show up in absolute measures of income growth.  However, there is a strange relationship of the second derivative.  If the growth rate in corporate profits increases, about two quarters later, labor income will also tend to increase.  On the other hand, if the growth rate in labor compensation increases, profits tend to decrease over the next few quarters.

Yet again, though, this could be a result of monetary policy.  If the Fed manages the business cycle based on a nominal Phillips Curve model, then monetary policy would be creating this correlation between rising wages followed by declining profits.  And declining profits would still lead to declining wages.

This would be ironic, but it makes sense.  Wages tend to be sticky and employment rates are a lagging economic indicator.  Equity owners hold the residual interest.  When economic shifts happen, they feel it first.  So, if the Fed thinks low unemployment is inflationary, and implements contractionary policy with an idea that this will lower inflation, they may be doing the opposite of what they think they are doing.  Instead of moderating wage inflation, they are moderating profits.

And, why would they expect contractionary policy to lower wage inflation?  What mechanism would be at work that would cause shifting monetary postures to play out initially and primarily in wage levels?  The mechanism would have to be falling profits, wouldn't it?  Isn't that the reason firms would be less willing to increase wages?

In this next chart, I compare the unemployment rate (inverted) with a scaled and detrended measure of the real total return on the S&P 500.  There is a clear cyclical relationship here.  In addition, there even appears to be a relationship over time in levels.  This only involves a couple of trend shifts since 1950, so it could be spurious.  But, when secular unemployment rates have been low, corporate valuations have been high and vice versa.

This suggests that there is a sort of Phillips Curve, but higher wages aren't being paid for with higher prices.  And higher wages aren't being paid for with lower profits.  Higher wages are being paid for with higher growth.  And there is enough growth to go around, so that profit expectations are rising as real wages rise.

This makes sense, too.  Quits rise when unemployment is low.  Employment flows into the labor force rise when unemployment is low.  This is not about us vs. them negotiating power.  This is about growth vs. stagnation.  When unemployment is low, workers might have negotiating power, but more importantly, they have the power of exit.  They can more safely test out alternative sources of income.  This is the real power.  Negotiating power is a fixed pie mechanism.  This power to leave is the power to sort better - the power to search more confidently - the power to become more productive.

We are the 100%.  "You go, we go."  When the Fed begins with the opposite presumption, their contractionary impulses hurt us all.  They should let it rip.  I'm not saying that they should aim for high inflation.  I'm just saying, they should stop worrying about things that are just not useful.  There are many reasons why a "hotter" economy might not be inflationary.  I wish we could give that a chance.


Friday, March 10, 2017

Cyclical Mixed Signals

I have become fairly bearish.  I think unfounded fears about "asset prices" and a bifurcation between returns on real estate vs. returns on fixed income is pulling the Fed to a position that is too hawkish with rate expectations that are too high.  Stagnating growth in debt is a really bad sign when, given the current economic fundamentals, mortgage debt levels are far too low.

That being said, the employment flows data is looking pretty upbeat.  Flows from unemployed to employed have recovered quite nicely.  And, I must admit that flows look a lot like 1999, when the Fed was raising rates, but economic expansion was pulling economic growth along, and long term rates were rising right along with short term rates.

Eventually, long term rates reversed and a correction followed in 2000.  So, I think the direction of long term rates is a decent bellwether of the direction of economic activity.  And, this has been mixed lately too, with rates rising late last year and then generally levelling off.  The sharp rise in sentiment in several surveys can't be ignored.

So, it seems we remain in a holding pattern.  I don't think that the risk/reward of positioning for a contraction is worth it, and it still seems too early to commit to positions that will gain from falling interest rates or from an eventual rebound.  It would be highly unusual at this point, I think, to see multi-year double-digit equity gains.  So, I don't see a lot of risk with being defensive.  I suppose there are idiosyncratic plays that will perform well, but this seems like a time where dry powder has its own value.

I haven't touched on unemployment duration data for a while.  Long duration unemployment continues to slowly recede, providing some ammunition for continued extra growth potential.  Before the Great Recession, we might have expected long term unemployment to be at about 1.2 million now, instead of 1.8 million.  Inferring from the BLS's median and average duration statistics, it seems as though that is basically where we stand now.  There are probably about 1.2 million workers who have been unemployed for longer than 26 weeks, who are re-entering the labor force at a typical rate.  Then, there are about 600,000 unemployed workers who have been unemployed for a very long time - more than 18 months, typically - who still identify as unemployed and in the labor force.  I wonder how much of that is related to the continued depression level residential construction activity.  I don't see a groundswell of support for solving that problem, so if that is the cause of the persistent long term UE problem, then it probably isn't going away in any case.

So, we seem to be at "full employment", with a persistent long term unemployed population that continues to decline at maybe 100,000 to 200,000 per year.  I'm not sure if that is enough of a boost to employment growth to make much difference.


Mixed signals again.

Friday, September 2, 2016

Labor Force Participation

A while back, I did several posts on labor force participation.  My general conclusion was that LFP wasn't as bad as it was generally made out to be for several reasons:

1) The hump and decline in LFP was largely due to a combination of (1) a one-time jump in female participation from the 70s to the 90s and (2) a long term secular decline across ages and gender.

2) When looking at male participation rates over the long term, there is a pretty stable slightly downward trend, except for the 16-19 and 55+ age groups, which have idiosyncratic movements based on cultural changes, etc.

3) LFP was above trend in 2007, so that forecasts tended to (1) start too high and (2) be flat or positive, which, in hindsight, was wildly optimistic, and contrary to half a century of experience.

So, LFP was a little bit below trend after the recession - not outside of historical norms, once the trend is accounted for.  Some of the downward trend of the 45-54 group is probably related to the way our disability programs induce people in that age group to leave the labor force, but that trend has been sloping downward for decades.  The 25-34 age group may have dropped by 1% or so in a way that will persist below the trend.

Within the working age groups, it looks like LFP has, more or less, recovered to expansion levels.  The 25-34 group might have some slack left.

This leaves a bit of a mystery for me, because I have been moving to an argument that we were deceptively in a sort of full employment recessionary condition by late 2006.  But, LFP moving above trend into late 2007 contradicts that idea.  This was a strange period, though.  Some of the growth in incomes was through rent inflation - most of which is imputed rent of owner-occupiers.  But, property values were flat or declining.  So, owners weren't getting any wealth effect from their properties, and in fact some were facing losses.  Owners had higher costs and incomes in a way that they would only know because the BEA told them they did.  Renters were transferring more of their incomes to landlords.  These amount to fractions of a percent of NGDP growth in a given year, but we are also talking about fractions of a percent of labor force participation.

It seems like there is something mysterious going on in the business cycle, when contraction is focused on housing, there is an increase in nominal production and income in a category that is mostly imputed - that requires no cash.  Wages rise.  Renters pay more of those wages to their landlords.  Owners pay themselves higher rents, though they don't know it.  So, a growing part of incomes is simply transfers on sunk costs to owners.  Does this create a boost in employment in the early part of the contraction?

In the current context, is employment even more of a lagging factor than it normally is?

Monday, April 18, 2016

Housing: Part 135 - Closed Access Rent Capture

Part of my theory of Closed Access housing is that limited access to lucrative labor markets in the Closed Access cities means that there are economic rents which can be earned by the high skill labor force of industries that value those limited labor pools.  Rents can also be earned by the firms that employ them because the same lack of access means that the firms have less competition.  But, much of these economic rents funnel down to landlords or existing real estate owners.

The employees are the valuable assets that can claim higher wages because of the limited competition, but since the limited access is created by housing, the workers have to pass their wages on to their landlords.  This is how high incomes and high rents remain sustainable.

But, different households have different demand elasticities for housing.  Low income households spend more of their incomes on rent, and at the margin where the next family is forced to move out of the city, they are spending the maximum that they can possibly spend on housing.  For those households, all of the economic rents they may be capturing are flowing through to their landlords.

But, as we move up the income distribution, households have more discretion about housing expenditures.  So, for higher income households who live in a Closed Access city in order to tap the high incomes, they can choose to downsize their housing consumption, and by doing this they can retain some of the economic rents from limited access for themselves.

Now that I have data on total residential real estate values, by MSA, (Zillow rocks!) I can estimate mean home values by city.  My hunch has been that housing expenditures would tend to skew negatively in the Closed Access cities.

Normally, most measures, like household income, skew positively because they grow on an exponential scale.  In other words, there are a few households with very high incomes, but there are a lot of households with just under the median income, so a typical distribution has a hump that kind of leans to the left (lower values) with a long tail moving to the right (higher value).  In this distribution, the mean value will be larger than the median value because those few very high incomes will raise the mean without changing the median.

Normally, we would expect housing to be less skewed than incomes, because households tend to spend more on housing as they earn higher incomes, but at less than a 1:1 ratio.  My hunch was that in the Closed Access cities, housing expenditures would be less skewed than in other cities because high income households would prefer to downsize to capture the rents of their excessive wages.

For the peak boom year - 2005 - I divided total real estate value from Zillow for each MSA by the number of housing units (from the ACS - form B25024) to estimate the mean value of housing units in the MSA, and I compared that to the median home value as computed by Zillow.  As with so many issues on this topic, my hunch proved to be understated.  Not only are the Closed Access cities less skewed, but according to this estimate, they manage to be negatively skewed.

In 2005, of the 20 largest MSAs, there were 4 that had a significantly negatively skewed housing stock.  Those are the 4 largest Closed Access cities.

The effects on economic stress are complicated here.  In one way, national income inequality is overstated when we just compare incomes, because most of the high incomes are coming out of cities where most of the labor force appears to earn more than average, but really just spends it on rent.  But, within those cities, income inequality is understated by incomes because as incomes rise the rent problem claims a lower proportion of income, and households use discretion to manage their expenses.

But, it would take a very detailed study to see the extent of any of these factors.  It could be that even among quite high income workers, even after downsizing, they don't have enough market power to capture much of the excess income.  Considering the rent problem appears to eat all the extra income of even the median households in the Closed Access cities, the lack of discretionary housing expenditures seems to rise quite a ways up the income distribution.


This is especially surprising, because Closed Access cities also have very high income inequality.  Here is a graph using data from the BLS that compares cities by the ratio of the 90th percentile income to the 10th percentile income.  The cities in red are cities associated with Closed Access MSAs.  So, relative to their high incomes, households at the top of the income distribution in Closed Access cities are sharply curtailing their housing consumption.


PS. Thinking about this more, I think the negative skew in housing consumption suggests that even at the top end of the income distribution, most rents are being funneled to landlords.  I suspect that incomes are bid down to levels that are near to the after-cost equivalents in other cities.  So high income households reduce their real housing expenditures but their incomes decline in some proportion  with their lower costs.

This is why this topic is so difficult to tease out of the data.  Average housing expenditures aren't that high in Closed access cities, by some measures I have seen, but this is because high income households in those cities have sharply reduced their real housing consumption.  The interplay between real and nominal become complex.

Monday, April 11, 2016

Private Investment and Recessions

I saw this reference to an upcoming Auclert and Rognlie paper (HT: EV) on inequality and the business cycle.  I can't see the full paper, but the abstract says:
A temporary rise in inequality, if not accommodated by monetary policy, has an immediate effect on output that can be quantified using the empirical covariance between income and marginal propensities to consume.
This seems like a strange idea to me.  Aren't falling profits and falling private investment leading indicators of coming recessions?  If that is so, then it seems odd that a lower propensity to consume would be a causal factor in a production contraction.  Maybe the key here is the monetary policy bit.  Maybe they are using interest rates as the proxy for monetary policy, so that a model that produces a downward shift in the natural rate while stable monetary policy is defined as a fixed interest rate, would lead to contraction.  I don't know if that's what's going on, but otherwise, it seems strange.

This led me to call up this graph:

Thinking about our current context, private domestic investment, minus residential investment, actually doesn't look that bad.  It's not blowing the roof off, but after the deep drop in the recession, we have recovered to pretty typical investment levels.

If we look at the top line, which includes residential investing (or the bottom green line which is the measure of residential investment), it looks a lot worse.  The recovery level is below all other post-war recovery levels, and is still roughly at levels we would normally consider recessionary.

This is the story of this decade.  Millions of construction workers have been sidelined.  How much of the persistent cyclical downshift in labor force participation was due to our misplaced concerns about homebuilding?  Unemployment has dropped in construction during the recovery, but labor force has not recovered.  (The employment and unemployment lines are stacked.)  So, 1% of the labor force was in construction and now has either left the labor force or moved to other industries.  Meanwhile, rents are skyrocketing and residential investment remains about 1%-2% below any past levels.
 
 
Meanwhile, real GDP growth seems to be about 1%-2% below typical recovery levels.  These seem like pretty obvious dots to connect.  We shut down mortgage lending, and for a decade, we have basically put 1% to 2% of the economy on mothballs.  There is one way to fix this economy, and only one way.  But, it would require the equivalent of admitting that we shouldn't have gone to war.  These sorts of decisions are not easy to reverse.
 
Given two choices: (1) it was probably a bad idea to invade Iraq, even if Hussein was a really bad guy, or (2) maybe, in general, banks were just kind of doing their jobs, and we should have taken steps to stabilized the mortgage industry as early as 2006*.
 
Which one would a plurality of Americans more easily cop to?  The almost universal initial reaction to the idea that I would even suggest #2 is indignation.


* I would say even as far back as 2003-2004.  One of the factors that I see in the data is that the expansion of the subprime industry itself seems to have been mostly a reaction to sharp cuts in mortgage growth at the GSE's and the FHA - especially in 2003 and 2004 after Congressional witch hunts into GSE accounting practices coincide with backpedaling at both Fannie and Freddie.  The rise of subprime, itself, was a sign, not of excess, but of stress - and of both supply and demand deprivation.
 
This seems hard to believe when residential investment was so strong in 2004 and 2005.  But, residential investment was inflated because (1) Closed Access housing policies in the large metro areas pressed housing expansion into parts of the country where single units were more prevalent and units of a given value required more fixed investment and (2) the high prices of the Closed Access cities inflated brokers' commissions, which are included in the aggregate measure.  If we adjust for these things, residential investment was at normal non-recessionary levels.
 
Measures are stacked
(We can see in this graph how low multi-unit investment had moved.  A unit-for-unit exchange of expensive downtown urban condos in the Closed Access cities for single unit homes in Arizona or Texas would, on net, reduce total residential investment because more of the value would come from location - less from materials.  This substitution from metropolitan condos to McMansions in the heartland probably added about 1/4% to 1/2% of GDP to residential investment during the boom, with no net benefit to the real value of the housing stock.)


Friday, April 8, 2016

Manufacturing Employment

I saw this earlier today, but I can't find it now, to give credit. Hat tip: KPC

But, I saw this graph of manufacturing employment as a percentage of total employment.

This looks similar to age adjusted labor force participation over long periods.  The trends on these measures are surprisingly linear.

Source
What's interesting about measures like this is that they are clearly signals of progress.  Move back a century and you'd have the same trend in agricultural employment.  Yet, progress causes dislocation, so as we experience progress, we treat it as failure.  And, over 70 years or so, along the way, the supposed causes of the faux failure are debated.  Those faux causes are mostly a window into our prejudices.  Some of us would like to blame this failure (that is to say, this progress) on creeping regulations, on foreigners, on unionization, on the decline of unionization, on taxes and spending, on a lack of taxes and spending, on greedy multi-national corporations.

How much of the public conversation around finance is based on arguments about things that aren't real that we can all hang our prejudices on.  It seems unavoidable to me that this will be the case.  Complex topics lend themselves to this problem.  I don't see how any of us can avoid it.

The line between using models and heuristics to approximate the world and imposing your prejudices on complex topics is too thin to parse.

Tuesday, March 22, 2016

Housing: Part 130 - Nominal Shocks, Leverage, and Employment

As I think through the implications of my alternative history of the Great Recession, I keep wondering how much of our collective notions about the causes of economic dislocation are a product of attribution error, hindsight bias, and an ancient discomfort we have with risk, in general (finance being the name we have for mechanisms we have developed for sharing and managing risk).

Inevitably, in a culture and an economy that exists above subsistence, saving is required.  As abundance has grown over time, forms and outlets for saving and investment have become more complex.  For any life more complex than hunting fruits and berries and killing small game, where nature's risks are always at the doorstep, speculation is mandatory.  This is true for even the first steps into agriculture.

In our world, we are all involved in wild speculation.  We have all optimized for a functional society with a complex array of utilities, public institutions, and market provision of highly technical goods.  Frankly, it sort of stresses me out to think about it because we just aren't built to trust the robustness of emergent order, but we all must do just that, to an extreme.  Mostly we cope by not thinking about it.

One of the ways we handle this unavoidable speculation is by engaging in a variety of risk-trading relationships, which, for the most part, settle into a set of social conventions that reflect common preferences, so we don't even think about it consciously most of the time.  Local certainty appears to be very valuable.  Much of finance involves trading local risk.  Equity holders take on short term volatility and both creditors and laborers tend to accept a discount to their incomes in exchange for that certainty.  This is why stocks generally have higher long term returns than bonds.  It is difficult to be tethered to the random walk, both emotionally and as an input in our personal financial plans.

But, there is a necessary trade-off with these risk-trades.  The gains in local certainty to laborers and creditors generally must come at the expense of more risks at the extreme.  Equity is exposed to constant, small-scale local risk, and in extreme conditions may encounter existential risk.  Labor and creditors experience this as a sort of regime shift.  They either exist in a context of relative income certainty or in a context of default or unemployment.

Real estate holds an interesting position here.  Mortgages with stable payments serve this function for both the borrower and the lender.  Homes are real assets - their values change with inflation and with local conditions.  Nominally fixed mortgages make a very poor asset-liability match.  But, what mortgages provide for both the borrower and the lender is cash flow certainty.  We use the general tendency for inflation, and amortization, to essentially push nominal uncertainty off the balance sheet of both the bank and the homeowner.

Note that both labor and creditors basically have made the same risk trade and face the same problems of dislocation when there are nominal spending shocks.  But, isn't it interesting how different our reactions to these two classes of participants are?

Political observers and academics both tend to ascribe the causes of dislocations from nominal shocks to financial leverage.  But, this is a truism.  We are all speculators.  We all optimize to some extent to our general expectations.  One aspect of this optimization will always involve trading short term risk.  If a nominal shock happens that is large enough to cause dislocation, it will, by definition, involve dislocation among these financial relationships that involve the purchase of short term certainty.  To ascribe causality to debtors is equivalent to blaming the grass for a drought.

But, you may respond, some people get complacent and take too much risk.  And those people are the ones that end up being the first dominoes to fall in a crisis.  The causality is right there in front of our eyes to see.  Is there any doubt that the housing crisis was heightened by the concentration of recent homebuyers with high leverage?  Is there any doubt that the crisis would have been less severe with less leverage?  No.  There is no doubt.  As far as it goes, this response is absolutely reasonable.

But, couldn't we also say that the drought would not have been so bad if the grass had deeper roots?  Couldn't we also point to the clever means of water retention that desert plants use and wonder why the grass wasn't doing the same?

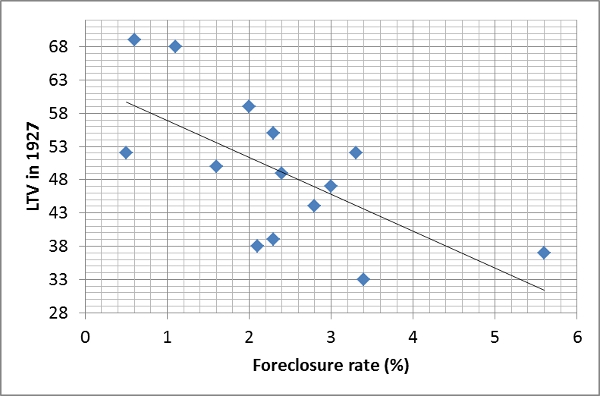
NPV Fig 2My point here is that even if the response is perfectly true, it is also not falsifiable.  Any nominal shock that is strong enough to lead to widespread dislocations will appear to have been caused by leverage.  Here is a post from the London School of Economics that explores the role of real estate speculation in the lead up to the Great Depression (HT: Benjamin Cole).

Here is a graph from the post.  The author, Natacha Postel-Vinay, makes some interesting observations about the real estate market of the time.  In some ways there were parallels to the recent crisis.  In the 1920s, piggyback loans began to gain popularity.  This graph suggests a strange outcome, that in cities with lower 1st lien leverage, foreclosures were higher.  She notes that this is because the lower leverage was associated with the use of piggyback loans, which were more vulnerable to economic stresses.

But, note, loan to values on first mortgages at the time were generally 50% or less.  The cities with the highest foreclosure rates had LTVs under 40%.  And, homeownership rates at the time were under 50%.  Actually, even in the recent crisis, average leverage among homeowners was less than 50% at the peak of the boom in early 2006, though there were certainly cities with concentrations of higher leverage.  So, if neighborhoods with LTVs above 80% or 90% were the cause of the recent crisis, would we have been better with LTVs under 80%, 70%, 60%?  Certainly we would have been less vulnerable to dislocation.  But, when dislocation came, would the story have changed?  If average LTVs in 2006 had been 30% or 40% instead of 45% or if there was a ban on mortgages with LTVs above 90% or 95%, then when dislocation arrived, would we have said, "Well, we can't blame leverage this time."?  Of course not.

And, note what we never claim.  We never apply this prescription to labor.  Even though the consensus among economists is strong that the difficulty for nominal wages to adjust downward is an important factor in episodes of unemployment, there is never an upswelling of academic papers and political candidates after a crisis that complain about our dangerous tendency to have labor contracts with stable wage levels.  We never complain that our unemployment comes from a rigged system where so many laborers recklessly pushed up the operational leverage of firms.  Nobody holds press conferences to complain that fixed-salary workers did this to us and bemoan that none have been prosecuted.

Yet, is there any doubt that if we instituted a law that required all labor contracts pay into a rainy day fund that firms could reclaim during nominal shocks that unemployment would be much less of a problem?  How reckless of us not to do that!  Maybe nominal crises are caused because laborers become complacent when there are long periods of stability.  Maybe appropriate public policy should aim to allow frequent employment shocks so laborers don't get complacent.

Funny how that sounds wrong, even though it is basically the same proscription that is seriously offered in the financial realm.  Operating leverage and financial leverage are both leverage.

Is there a façade of empiricism here?  Do our shared notions about the causes of economic shocks exist in a plane above and disconnected from empiricism?  Are we simply projecting our human biases in a subconsciously predetermined narrative?

If leverage is dangerous, the way to reduce it over the long term isn't through cyclical second-guessing.  Corporate leverage has actually been very low going into the last two contractions.  The reason leverage in general, by some measures, was too high was because low interest rates and supply constraints in housing had increased the value of homes.  But, low long term interest rates are hardly a sign of speculative fervor.

Source
If leverage is dangerous, we can easily reduce the advantages that debt gains through tax and public policy.  To reduce leverage in housing, we have to start building homes in high value locations.  These are structural issues.  To solve this cyclically is a public policy minefield, and simply diverts attention from policies that could provide nominal stability.  As much gnashing of teeth as their has been about bailouts and excess in the recent crisis, this was a perfect example of a crisis where we introduced extreme nominal instability because we were so concerned about debt.  And, since the cause of the crisis was predetermined, when we introduced instability, we still all agreed to blame that debt.

There were observers complaining about housing bubbles as early as 2001 or 2002.  But, even when the crisis hit, aggregate home prices never fell below the prices of 2003.  Suppose we had introduced enough nominal instability in 2003 to cause home prices then to fall back to 2001 prices.  Would the story have changed?  Millions of mortgages originated in 2003 and 2004 had low default rates.  But, in this scenario, many would have defaulted.  Is there any question about where the blame for the instability would have been laid?  There is no question.  We would have blamed debt and speculation.  Yet, we know that there was nothing wrong with those mortgages.  They have performed quite well, even though those 2004 cohorts have dealt with volatility unheard of since the Great Depression.