Saturday, April 30, 2016

Housing: Part 142 - Limited housing supply is the reason for everything.

I am giddy with excitement.  I have been working on neighborhood level and zip code level home prices, rents, and incomes, and the result is astounding.  I have been describing the housing problem as a major cause of everything from the housing bubble to income inequality to general economic malaise.  What I have been working on this week may be the most devastating information I have found since the beginning of this project.  Zip code level data shows completely equitable income growth outside of the Closed Access cities.  Additionally, outside the Closed Access cities, housing price appreciation from 1998-2006 shows no systematic difference between low income and high income zip codes - strongly implying that credit constraints had little or nothing to do with rising prices - even in places like Phoenix and Las Vegas.  I wouldn't believe it myself, if I wasn't working through the data.  Housing is the story.  Housing and migration explain it all.  Of course, price declines since then are highly tilted against low income zip codes - credit constraint signals are all over the data since 2006.

Up until 2006, housing restrictions in the Closed Access cities explains it all, and after 2006, constraints in the mortgage credit market explain it.  A year is too long to wait to get this out.  I have never been more excited about these results.

Then, I see this paper, which had slipped my attention before now. (HT: John Wake)  From the abstract, regarding causes of local home price appreciation:
none of the demand-shifters analyzed show positive pre-trends, but some such as the share of subprime lending, do lag the beginning of the boom. This suggests that key players in the lending market more responded to the boom, rather than caused it to start.

Yes, yes, and yes.  I have ceased being surprised by new information that undermines the credit causation story, but I never thought that in the process of writing the book things would be coming together this well.

By the way, in the Ferreira & Gyourko paper linked above, in cities where home prices moved up, guess what factors had the strongest significance at both the neighborhood and MSA level?  Mortgage rates before the break, migration before the break (only available at MSA level), and homebuyer incomes during and after the break.
________________________________

Here is some data by using IRS and Zillow numbers for over 15,000 zip codes.

First, here is a histogram of log incomes, before and after tax, relative to the US median.  And the composition of these distributions really is direct.  In other words, Closed Access housing policies basically mean that the hump from the middle of the gross income distribution has been picked up and moved to the low end of the distribution of incomes after rents.

We can see that in the next graph, in which there are dozens of zip codes with relatively normal gross incomes where rents are extremely high.  These are the Closed Access zip codes.  These are the zip codes where the middle class is getting squeezed.

This is only half the story.  Since discretion about housing consumption increases with income levels, high income households in the Closed Access cities have similar relative rent expenses to Open Access cities, but as income levels decline, the ability to reduce housing consumption also declines.

This actually gets somewhat complicated, because incomes across Closed Access cities are inflated by the effects of limited access on wages.  So, those households in the red circle have incomes before rent that are higher than they would be in an Open Access regime, but incomes after rent that are lower than they would be in an Open Access regime.  This is the source of the migration pattern we are seeing out of the Closed Access cities.  High income households that can leverage their skills in those labor markets with inflated incomes and also can reduce their real housing consumption, move in, and low income houses get squeezed until some decide to pick up their lives and move away.  They are willing to put up with some economic stress before involuntarily moving to another city, so the incomes of lower-middle class households that remain tend to be low, after adjusting for cost.  And, when a household does move, their gross income tends to fall, even though their discretionary income after rent will tend to rise.

The other half of the story are those inflated incomes that come from Closed Access.  Maybe the easiest way to think about it is that those middle class and lower middle class households that move away to Open Access cities are actually normalizing their incomes.  Those high income households in the Closed Access cities have inflated incomes.  If the Closed Access cities built millions of new housing units, the top end of the income distribution, both before and after costs, would pull back.

The supposed hollowing out of the middle class is entirely a result of this migration pattern.  There is no signature of this phenomenon within the Open Access cities.  The reason that the national distribution of incomes looks like there is a hollowing out of the middle class is because the migration pattern through the Closed Access cities produces a bunch of high income households with inflated incomes and a bunch of middle income households that raise their discretionary incomes by lowering their gross incomes, through migration.


This last scatterplot is another way to look at it.  That bunch of unusual zip codes at the bottom are Clsoed Access zip codes with a bunch of middle class and lower-middle class households struggling to remain in their home cities.  (Many of them are protected by rent control, so some of the migration is triggered by the transfer of properties to their full values by selling them to buyers willing to pay market value.  There is a balancing act there, I suspect, between the transfer taken by the owner because through below market property taxes and the transfer taken by the tenant through below market rents.)

I think this graph allows us to visualize the mutual economic trade-off that happens through this migration.  The high income household, moving from, say 11.5 to 12 in log income (roughly moving from $100,000 to $160,000) by tapping into local labor networks, reduces their housing consumption in order to capture that income, so they move up and to the right in our graph.  The household migrating away might be moving from 10.5 to 10.25 in log income (roughly $36,000 to $28,000).  But in the process, they can actually move into materially better housing while gaining discretionary income.  They move up and to the left.

Unfortunately, Zillow rent data only goes back to 2010.  I suspect that this problem was less pronounced before 2006, because the option of migrating was accommodated by the housing boom.  Since there are fewer outlets for mitigating this dislocation now, the pain that existing Closed Access residents are willing to take before it triggers a move to an Open Access city is probably larger.  This means that the migration pattern has declined since 2006 and incomes after rent have been pushed further from the norm in Closed Access cities.

This is a problem.  A household has been forced to move away from their chosen home against their will.  But, as a nation, we are battling a bunch of hobgoblins here, creating an incredible amount of additional economic damage, when the cause of these problems is primarily in this one factor - Closed Access housing.  I don't have high expectations that this problem can be solved, soon if ever.  But, at least the rest of us can stop going on witch hunts and start dealing with the problem in ways that have utility.  In fact, the main thing we have accomplished is that we have removed the option for a lot of these lower-middle class households to increase their incomes after costs by migrating, because we have now created Closed Access housing tendencies throughout the country by hamstringing the mortgage market.

I have no doubts now about the strength of the narrative I am writing.  I feel extremely fortunate that I have found myself in the position to tell this story.  My main concern is that the damage we have inflicted has been so severe and so explicit that many people will react defensively.  To really believe my story, you need to realize that, lacking a solution to the Closed Access housing problem, the banks were accommodating relief and that supporting mortgage and housing markets would have been key to a stable and growing middle class.  To someone who has been down on the streets marching with Occupy Wall Street protesters, or who has been giving support to those movements - to someone who has been demanding retribution against bankers - to accept the story I am telling requires eating a lot of crow.  It would be hard enough to just make the argument that all of the culture war / class warfare stuff that populates political discourse is insignificant and that the solution lies outside the tribal score-settling that motivates us.  I would expect that argument to fail to win hearts and minds.  But, I have to go further than that, and say that, to believe my story is to accept that the policies that have been practically universally demanded, with anger and indignation, have caused untold economic damage.  We have been fighting an unjust war.

I have been really lifted up by the support I have received from those who have seen the story so far.  But, the cognitive dissonance this should create in many potential readers will be deep, and I am afraid that the reactions to that will be fierce and ugly.  I'm not sure I am ready for that.

The story needs to be told.  But I am not looking forward to standing in front of the pitchfork wielding mob to claim that the witches were innocent.

Follow up.

Thursday, April 28, 2016

Housing: Part 141 - Prejudice Clouds Thinking about the Banks

The New York Times has an article about new investigations into Morgan Stanley's role in the housing bubble (HT: John Wake).  Typical evidence from the article:
The documents suggest that the primary way Morgan Stanley guided New Century was in contracts that spelled out the kinds of loans the bank was willing to buy in pools of mortgages. A 2006 term sheet said that the bank wanted a $1 billion pool to be at least 85 percent adjustable-rate mortgages, with at least 75 percent of the pool to include a prepayment penalty. And it dictated how many loans the bank wanted from various geographic regions.
So, do you get that?  Do you see how dastardly Morgan Stanley was?  They told a mortgage originator what sorts of mortgages they would like to buy.  Dirty bums.

I will tell you that, on principle, whenever I do something like buy a new car, I refuse to tell the salesman anything about what kind of car I need.  Why?  Because I'm not an animal.  I have morals.  Whatever sorts of cars the factories are making, I'm sure those will work just fine.

Seriously, though, it amazes me what a low bar there is to imagining what sort of nonsense banks were up to.  I suppose the idea here is that, since they were predators, these sorts of impositions are just ways to extract fees from helpless customers.  As if this is just a one way street.  The fat guy in the tux, with dollar bills stuffed into his chest pocket and a fat cigar in his mouth, maniacally laughing after sending out his new more devilish plans.

But, these are just standard risk management issues.  Remember, by the time these private loan pools were numerous, the Fed Funds rate was nearing 5% and the yield curve was flat.  At that point in the cycle, ARMs are commonly used.  The level of ARMs was not even high (pdf), relative to past levels.  The reason, I presume, that they wanted ARMs was because reasonable borrowers would be more apt to use ARMs, and when rates are high or rising, adjustable rates eliminates interest rate risk.  This is finance 101 stuff.  Same deal with the prepayment penalty.  The fact that mortgages can be refinanced makes mortgages much less valuable as interest rates rise, increasing the spread lenders have to charge.  As rates rise, if prepayments aren't mitigated somehow, lenders have to charge higher rates (which, here, means that Morgan Stanley would demand a higher rate on the mortgage bonds).

This idea that ARMs were some sort of conspiracy is so dumb, I don't know what's happened to the world.  People used to know these things.  The housing "bubble" ate our brains.  This is made more exasperating by the fact that rates went down after those 2005 and 2006 ARMs were originated.  Nobody lost their house because rates went up on their adjustable mortgages.  They lost their homes because the mortgage industry was shuttered, their equity vanished, and once the broader dislocation hit, many lost their jobs and couldn't make payments, sell, or get refinanced.  Most defaults happened after 2008, by the way, when rates were WAY down.

And, they "dictated how many loans the bank wanted from various geographic regions."  Um.  OK. Why does this warrant a mention?  If you work for a bank that buys mortgage securities and you DON'T dictate how your holdings are geographically diversified, please go into your boss' office and inform them that you are firing yourself.  This is basic stuff.

I really don't know how to address this stuff in the book.  So many of the details like these have little credibility to me.  But, there is the problem that in a nation with millions of mortgages, especially in the middle of a housing supply bust, there is bound to be a set of credible anecdotes about actual fraud, and there are bound to be even a few whole operations that operate at the border, or over the border, of reasonable tactics.  But, the problem is this is all bathed in what can only be called bigotry.  Anecdotes become generalized to "what Wall Street was doing" and this is combined with trumped up and incoherent accusations that frequently simply don't mean anything.  These are basic, well known tools of bigoted thinking.  Bigotry in some form has always been a problem in human endeavors, because these tools are effective.  And it usually doesn't go away because people notice what they are doing and adjust.  It goes away by generations slowly succumbing to lived experience.

For this reason, I almost prefer to not address it at all.  This will lead many readers to dismiss my other arguments.  But, I think many of those readers will not be on the margin of readers who might consider my thesis, anyway.

Any input is welcome.  This may be the most difficult issue I have to tackle, rhetorically.  Is it enough to simply tackle the empirical issues (the lack of rate-triggered defaults, the normal behavior of ARM originations, the fact that these cases all focus on banker's actions after 2004 - generally after the peak of ownership and prices).  Is all that enough without having to act like a defense attorney in the witch hunt-of-the-day?

Tuesday, April 26, 2016

Housing: Part 140 - Outlawing reality

 These two items came across Twitter today within a few hours of each other.  Note the Debt to Income limits on Qualified Mortgages - 43%.

This should work out really well!

It's astonishing that homeownership in California has actually stabilized in the last couple of years.  How does anyone there find someone to sell them a mortgage in this atmosphere?


How to make city housing more affordable (Hint: build more) https://t.co/jMi4M6ksEy pic.twitter.com/wUTkplIOI8
— Nick Timiraos(@NickTimiraos) April 25, 2016


Best thing from Frank-Dodd and the Consumer Financial Protection Bureau, Qualified Mortgageshttps://t.co/vLqeW1EsTm pic.twitter.com/jvBG4yBZpU
— John Wake (@JohnWake) April 25, 2016

Monday, April 25, 2016

Housing: Part 139 - "Demand" side vs. "Supply" side and the NGDP measurement problem.

One aspect of my story, as it relates to monetary policy, is that, contrary to popular opinion, monetary policy was not particularly loose at any time during the 2000s, and that eventually, really starting at least as far back as the sharp pullbacks in GSE originations in 2003 and 2004 after the accounting restatements, a series of demand shocks eventually built up until they caused a recession.  Or, I have been calling them demand shocks.  Maybe I am using the wrong terminology.  Give me advice if anyone has any ideas.

The problem is that we normally think of bank credit as "demand" because we would expect it to fund additional spending and lead to an expansion of currency.  But, I contend that the higher mortgages of the housing boom were not associated with demand or expanded spending.  They were a reflection of transfers to previous Closed Access real estate owners.  To the extent that Closed Access homes were sold at profits, the old owner received a windfall and the new owner took on new debt that was a reflection of future high rent payments.  I don't see any reason to think that those mortgages were funding net new spending.

But, since credit is usually associated with demand, I have been referring to the series of negative shocks to the mortgage credit market as negative demand shocks.  I think I need to find better terminology.  Because, those mortgages fund housing starts where housing starts can be funded, so really, negative shocks to mortgage credit were negative supply shocks.

Link
And, this is the strange way that the recession was related to a sort of perverse NGDP behavior.  Since housing demand is inelastic where supply is constricted, the shocks in the mortgage market were causing housing starts to collapse, which led to the high rent inflation of 2006 and 2007.  This meant that real GDP growth was falling.  Nominal GDP growth held up somewhat because of the high rent inflation.  I say that both measures were in recession territory by the end of 2006.

But, we didn't call it a recession, because employment was still strong.  Employment was strong because the Fed had inadvertently created a supply-shock recession based on supply shocks that they didn't recognize.  And, since housing demand is inelastic, the more they pulled back on the credit levers, the higher rent inflation and NGDP went.  This meant that there was no sticky wage problem, there was just a ratcheting up of costs.

We ended up with monetary offset - against itself!  First, the Fed and Treasury created a supply shock by ratcheting down the mortgage market, then they reacted to that by adding a demand shock by cutting off currency growth.

I have been attributing this completely to rent inflation.  But, now, I think maybe import inflation plays a role here.  I will try to address that in an upcoming post.

--------------------------
I have been arguing that NGDP growth has been overstated since 1995, and was especially overstated in 2006 and 2007 because higher rents in Closed Access cities are measured as inflation, when they are more akin to a tax (of Closed Access wage earners) and transfer (to landlords).  If I just adjust GDP with the different inflation rates (with or without shelter inflation), there is a difference between the two.  But comparing total GDP to GDP (ex. housing) gives very little difference.  I assumed it was because of some trick in GDP growth calculations that I didn't understand.  Today, it hit me.

Migration has become a core part of the story, and I realized this forces all the shelter inflation to be mitigated with substitution.  There is no way for it not to be mitigated through substitution because the core act in the story is that when a high income household moves into a Closed Access city, a low income household has to move to Phoenix.  So, there is some rent inflation in San Francisco and a new home in Phoenix of much lower value than the home in San Francisco.  Shelter has been about 18% of nominal consumption for decades.  A longterm flat trend.  After that migration is triggered, spending on housing in both cities remains the same as a portion of incomes.  The cost comes from the family that must move out of San Francisco, lowering both their income and their housing expenses.  The counterfactual doesn't come from the difference in non housing GDP and total GDP.  The difference comes from total GDP and an unmeasured potential GDP.  We can estimate this by applying different inflation rates, where the substitution isn't accounted for.  But substitution has to make the difference disappear in GDP figures because the substitution is the story.

Thursday, April 21, 2016

Housing: Part 138 - The illiberal core of human nature

Here is a great article from TechCrunch.com, by Kim-Mai Cutler, from back in 2014.  It is a really good primer on the housing problem in the San Francisco area.  Tons of information.  A lot of the article is on local details that are at a different scale of the problem than the frame of reference from where I have been working.  But, one part caught my attention, regarding the way people think about prices.

Earlier in the summer of 1978, a cantankerous former small-town newspaper publisher named Howard Jarvis led a “taxpayer revolt” as property prices were soaring, threatening to throw home owners out of their homes because of rising tax bills. Jarvis’ idea was to cap property taxes at 1 percent of their assessed value and to prevent them from rising by more than 2 percent each year until the property was sold again and its taxes were reset at a new market value. 
One argument that Jarvis used to rally tenant support for Proposition 13, was that he promised that landlords would pass on their tax savings to renters. 
They didn’t. They pocketed the savings for themselves. 
Tenants were furious, and rent control movements erupted in at least a dozen cities throughout California, from Berkeley to Santa Monica. 
San Francisco might have gone a different way, but Angelo Sangiacomo was the alleged trigger. The Italian-American landlord, who was born and raised in the Richmond District, demanded across-the-board rent increases of 25 to 65 percent in seventeen hundred apartments in March of 1979. 
Amid the outrage, Feinstein pushed for a 60-day rent freeze that would ward off the rise of a tenant-backed mayoral challenger. 
Both policies have had far-reaching and unanticipated ripple effects.

The key part here is, "he promised that landlords would pass on their tax savings to renters. They didn’t. They pocketed the savings for themselves.  Tenants were furious, and rent control movements erupted in at least a dozen cities throughout California, from Berkeley to Santa Monica. " followed by follow-on policy responses that worsened the problem even more.

Rent/Income levels will reach an equilibrium point that has very little to do with property tax rates.  How could they?  Lower property taxes will mostly just increase the Price/Rent ratio because gross rent will generally be set by tenant supply and demand, and lower property tax will increase the net income to the landlord.  (So, yes, right off the bat, this law made the source of the problem worse, as a direct effect.)

In an Open Access city, lowering rates would raise home prices, inducing more building.  This would lower rents on existing homes.  But, since the problem of rising property taxes on windfall unrealized profits was a problem specifically caused by inelastic housing supply, the fact that the problem existed at all was a good sign that the proposed solution would fail.

This idea that prices are a reflection of the moral generosity of those who are considered to be powerful (the buyer, in the case of labor; or the seller, in the case of housing) is such a deep universal intuition.  It will always be something that has to be unlearned.  And, this isn't limited to economics.  We are born deeply illiberal.  It's amazing that modern liberal civilizations ever gained a foothold, let alone were sustained.

"Gay people should just find a nice girl to settle down with and stop pushing this issue in our faces."
"Mexicans should find jobs where they live and start respecting our border."
"Women should know their place.  Having a career isn't the only way to be successful."
"Stores should pay their workers higher wages.  Everyone has a right to earn a decent living."
"It's unfair that landlords didn't pass this tax cut on to their tenants."

All of these statements are illiberal statements in the same way.  It is basically Attribution Error at the social scale.  Any large group of individuals will behave, as a group, according to their relative set of needs and available opportunities.  You might as well consider it a law.  It is hard to conceive of it as a law, because the rules of the law change along with the sets of available opportunities.  But, as a general rule, if a large group of people are doing something you don't like, you can either live with it or change their available set of opportunities.

Getting angry at an entire state's worth of landlords because they didn't pass on a property tax cut is dumb.  Rents are a product of the available opportunities.  The way to improve opportunities for tenants in California is to build houses.  The problem is that after several rounds of illiberal attempts to fix problems caused by illiberal policies, California is now populated with a bunch of tenants whose current rents are unrelated to the current set of other housing options, a bunch of owners whose property taxes are unrelated to the property tax a new owner would pay, and millions of illiberal voters who don't get why this is a problem and whose solution to every problem is to put their illiberal thumbs down on the most salient targets.  The fact that many of these people refer to themselves as liberals only confuses the matter.

PS: Note that all those Californians were angry because they assumed that taxes on capital would be passed on to the consumer.  Yet, amid the ever-constant drumbeat about corporations paying more taxes, isn't it funny how that idea seems to disappear?  In that context, the assumption appears to be that corporations just have to swallow whatever tax is directly imposed on them.  Is the difference really that Californians thought there was some sort of multi-million person gentleman's agreement that landlords would deviate rents from their market levels after the property tax had been reduced?

Think of the Gordian knot of peculiar self interests California has imposed on itself at this point.  Practically every piece of property has its own peculiar tax rate and tenant rent based on the arbitrary path of ownership and tenancy of the property.  There is no market price for millions of properties.  Potential buyers and sellers all have different prices based on their own personal characteristics.  No wonder so many Californians think markets aren't working.

Note also that rent control basically conveys the same entry fee dynamic on renters that Closed Access policies impose on owners.  For a home buyer, Closed Access policies mean that you have to commit to owning an ever more over-priced property.  So, you have to pay more for a home today because the market presumes that rents on that home will be even more outrageous in 10 or 20 years than they are today, making your upfront entry fee even higher.

For renters in a city characterized by widespread rent control, their starting rent will end up moving to a much higher level than it would have been without rent control.  In a way, this is simply a matter of the supply problems that these policies create.  But, if you think about it from the demand side - the rent new marginal renters are willing to pay - they must be willing to pay more, because once they establish a foothold in an apartment, if laws prevent rents from rising at the market rate, then new renters will be willing to pay more to get into a unit, knowing that their rents will slowly fall over time, relative to the market.  So, whether they understand this or not, some new worker in San Francisco who is paying 80% of their wage on rent, may complain about their wages being too low for the local cost of living.  But, really, a good chunk of that rent is a prepayment on future below market rents.  Closed Access policies keep out marginal new entrants.  It's what they do.  How they do it may not always be obvious to those who impose the policies, but somewhere, eventually, prices will convey the information of Closed Access.

Wednesday, April 20, 2016

Housing: Part 137 - Financialization = Closed Access

Another paper on the dangers of financialization.  This one from  Jorda, Schularick and Taylor (2016).  (HT: JH)  This follows the pattern of most research on this topic, placing the cause in credit markets.  But, the cause is the high value of urban density and the inability of modern cities to allow the density that they were designed to create.  The cause is Closed Access policies that lead to high urban housing prices.  Financialization is a result of this, not the cause.  This difference in interpretation leads to conclusions that are diametric.  If financialization is the cause, the problem appears to be financial liberalization, and the solution appears to be to try to reduce the use of credit.  If Closed Access is the cause, the solution is more liberalization - in housing and in credit.  And, ironically, this will lead to a reduction in credit.

From the paper:
Throughout this chapter we use the term “leverage” to denote private credit-to-GDP ratios. Although leverage is often used to designate the ratio of credit to the value of the underlying asset or net-worth, income-leverage is equally important as debt is serviced out of income. Net-worth-leverage is more unstable due to fluctuations in asset prices. For example, at the peak of the U.S. housing boom, ratios of debt to housing values signaled that household leverage was declining just as debt-to-income ratios were exploding (Foote, Gerardi, and Willen 2012). Similarly, corporate balance sheets based on market values may mislead: in 2006–07 overheated asset values indicated robust capital ratios in major banks that were in distress or outright failure a few months later. (pg. 5)
This is because Closed Access is pulling down incomes.  That is why debt/income ratios are low.  It is the income ratio that is out of whack here, not the debt ratio.  The debt/asset ratios were normal before the bust because those assets are claiming more of the future output, because of Closed Access policies.  The fall in capital ratios was due to the unnecessary bust.
Figure 4 shows that the ratio of household mortgage debt to the value of real estate has increased considerably in the United States and the United Kingdom in the past three decades. In the United States mortgage debt to housing value climbed from 28% in 1980 to over 40% in 2013, and in the United Kingdom from slightly more than 10% to 28%. A general upward trend in the second half of the 20th century is also clearly discernible in a number of other countries.  (pg. 11)
I show Figure 4 above.  Actually, in the US, the sharp rise in Loan-Value was because of the bust.  As stated by the authors above, debt-asset ratios have not been high.  They weren't high when the bust hit.  When we remove that sign point from Figure 4, we see that Loan to Value has not particularly been rising since the 1970s.  The other countries in Figure 4 did not have housing busts.

In the span of the last 60 years, the ratio of mortgages to GDP is nearly six times larger; whereas, measured against housing wealth, mortgages have almost tripled. Of course, the reason for this divergence is the accumulation of wealth over the this period, which has more than doubled when measured against GDP. (pg. 14) 
This wealth is based on claims on future limited housing stock.  It is wealth based on limited access.  It is wealth based on a decline in liberalized capital markets.
The change in Exports/GDP and Imports/GDP are both typically procyclical (the correlation is positive) but this effect is more positive with high leverage, and for these variables Imports/GDP shows greater procyclicality (rising from 0.2 to 0.6) than Exports/GDP (rising from 0 to 0.4) throughout the range. This suggests that local leverage levels may hold more powerful influence on the cyclicality of the import demand side than on the export supply side, lending prima facie support for theories that emphasize the impact of financial sector leverage on demand rather than supply channels.  (pg. 45)
This is because Closed Access policies bring economic rents to urban firms and workers.  As economies grow, Closed Access workers collect excess profits from foreign consumers which they spend on imports.  In a way, this is semantic, since the products of these Closed Access workers are sold to foreigners, but many new-economy goods and services are delivered locally, so they are not counted as exports.
At a basic level, our core result — that higher leverage goes hand in hand with less volatility, but more severe tail events — is compatible with the idea that expanding private credit may be safe for small shocks, but dangerous for big shocks.  (pg. 46)
The lower volatility is because as economies grow, a toll is paid to the Closed Access cities, dampening real income growth.  But, this toll is gathered through the ownership of Closed Access housing, which is a sort of high-risk growth-based asset.  It's value is based on the future ratcheting up of Closed Access rents.  So, now, the housing stock has taken on characteristics more like the stock market.  When expectations of future economic growth change, this creates large shifts in equity values.  Now, this same pattern affects Closed Access real estate values.

This is made worse by the widespread idea that financialization and credit are the problem.  So, as in the recent recession, policy makers who should be focused on stability instead see instability as a necessary evil in order to reduce credit levels.

Here is another figure from the paper.  Notice what a strong negative relationship there is between Credit/GDP and Investment.  That's because the rise in credit is almost completely due to the Closed Access housing problem.  So, as more savings gets sucked up when high income workers bid up existing homes to access Closed Access labor markets, less savings is available for investment in new capital.

I hope there comes a day where all of these studies are repeated, and wherever "financialization" appears, it is replaced with "capital repression through housing", or more concisely, "Closed Access".  Until then, we have illiberal capital policies, via housing, that are creating poor outcomes and we are fighting them with more illiberal capital policies.  The problem is that prices are information.  They will reflect the underlying reality.  If we don't solve the problem of Closed Access, then the only way that sucking credit out of the economy can change the relative value of those homes is if it damages the entire economy enough to reduce the future value of those labor markets.  This is what we did in 2006-2007.

Since then, we have continued to impose credit market repression, so that now home prices are too low.  Home owners are capturing income at rates above their normal levels, compared to alternative capital income sources, because the hobbled credit market keeps leveraged buyers out of the market.  But, this can't bring rents down.  In fact, it causes rents to rise even faster, because low home prices are preventing new home construction from taking place.

The striking thing is that these urban housing issues are hardly a secret.  The sharp limits on housing expansion where incomes are high is affecting tens of trillions of dollars of capital around the world.  This problem should be clear.

Liberalization is the solution, not the problem.  When even the economic academy can't see this as the core problem of our time, then I fear we are in for some difficult times.  A growth rate a percent or two below trend is probably manageable, though over time is damaging.  But the real downside here is if the social tensions and anger that come from these problems continue to fester, the public outcry will be to double down on repression.  A vicious cycle is the biggest danger.  The ascendance of Sanders and Trump in the current election is a warning about how near this danger is.

Tuesday, April 19, 2016

Housing: Part 136 - Income Inequality after Rent

I decided to see how inequality between cities has evolved.  I used the largest 151 MSAs for which Zillow has rent and income data.  Then, assuming that all residents in an MSA have that MSAs median household income, I created an inter-MSA Gini Coefficient.  This should create a measure of the income inequality that comes from differing incomes between cities.

I created two measures.  One was the Gini coefficient on household income.  The second was the Gini coefficient on household income after rent expenses (using MSA income and the Zillow rent affordability index).  I compared 1986, 2007, and 2015.

The income Gini has risen from 7.4 to 9.4.  The Gini based on income after rent has remained fairly flat.  It was 8.1 in 1986 and 8.2 in 2007.  It has risen to 8.5 in 2015.  I would argue that this is because the housing bust did not solve the problem of Closed Access rent seeking, but it did export the rent inflation problem to the formerly Open Access parts of the country.

So, measured wage inequality over the past 30 years has been overstated, because those high wages at the upper end of the income distribution mostly serve as a conduit for economic rents to flow to Closed Access rents.  (This created a one-time windfall for former property owners, but doesn't really convey any ongoing benefit to new owners.)

On the other hand, as I pointed out in yesterday's post, the ability for the highest income households to use more discretion in their housing consumption means that they are capturing more of those economic rents for themselves.

This becomes complicated very quickly, and when considering this sort of discretionary time-shifting of consumption, I suspect it probably becomes nearly impossible to compare relative real incomes, either over regions or over time.

Monday, April 18, 2016

Housing: Part 135 - Closed Access Rent Capture

Part of my theory of Closed Access housing is that limited access to lucrative labor markets in the Closed Access cities means that there are economic rents which can be earned by the high skill labor force of industries that value those limited labor pools.  Rents can also be earned by the firms that employ them because the same lack of access means that the firms have less competition.  But, much of these economic rents funnel down to landlords or existing real estate owners.

The employees are the valuable assets that can claim higher wages because of the limited competition, but since the limited access is created by housing, the workers have to pass their wages on to their landlords.  This is how high incomes and high rents remain sustainable.

But, different households have different demand elasticities for housing.  Low income households spend more of their incomes on rent, and at the margin where the next family is forced to move out of the city, they are spending the maximum that they can possibly spend on housing.  For those households, all of the economic rents they may be capturing are flowing through to their landlords.

But, as we move up the income distribution, households have more discretion about housing expenditures.  So, for higher income households who live in a Closed Access city in order to tap the high incomes, they can choose to downsize their housing consumption, and by doing this they can retain some of the economic rents from limited access for themselves.

Now that I have data on total residential real estate values, by MSA, (Zillow rocks!) I can estimate mean home values by city.  My hunch has been that housing expenditures would tend to skew negatively in the Closed Access cities.

Normally, most measures, like household income, skew positively because they grow on an exponential scale.  In other words, there are a few households with very high incomes, but there are a lot of households with just under the median income, so a typical distribution has a hump that kind of leans to the left (lower values) with a long tail moving to the right (higher value).  In this distribution, the mean value will be larger than the median value because those few very high incomes will raise the mean without changing the median.

Normally, we would expect housing to be less skewed than incomes, because households tend to spend more on housing as they earn higher incomes, but at less than a 1:1 ratio.  My hunch was that in the Closed Access cities, housing expenditures would be less skewed than in other cities because high income households would prefer to downsize to capture the rents of their excessive wages.

For the peak boom year - 2005 - I divided total real estate value from Zillow for each MSA by the number of housing units (from the ACS - form B25024) to estimate the mean value of housing units in the MSA, and I compared that to the median home value as computed by Zillow.  As with so many issues on this topic, my hunch proved to be understated.  Not only are the Closed Access cities less skewed, but according to this estimate, they manage to be negatively skewed.

In 2005, of the 20 largest MSAs, there were 4 that had a significantly negatively skewed housing stock.  Those are the 4 largest Closed Access cities.

The effects on economic stress are complicated here.  In one way, national income inequality is overstated when we just compare incomes, because most of the high incomes are coming out of cities where most of the labor force appears to earn more than average, but really just spends it on rent.  But, within those cities, income inequality is understated by incomes because as incomes rise the rent problem claims a lower proportion of income, and households use discretion to manage their expenses.

But, it would take a very detailed study to see the extent of any of these factors.  It could be that even among quite high income workers, even after downsizing, they don't have enough market power to capture much of the excess income.  Considering the rent problem appears to eat all the extra income of even the median households in the Closed Access cities, the lack of discretionary housing expenditures seems to rise quite a ways up the income distribution.


This is especially surprising, because Closed Access cities also have very high income inequality.  Here is a graph using data from the BLS that compares cities by the ratio of the 90th percentile income to the 10th percentile income.  The cities in red are cities associated with Closed Access MSAs.  So, relative to their high incomes, households at the top of the income distribution in Closed Access cities are sharply curtailing their housing consumption.


PS. Thinking about this more, I think the negative skew in housing consumption suggests that even at the top end of the income distribution, most rents are being funneled to landlords.  I suspect that incomes are bid down to levels that are near to the after-cost equivalents in other cities.  So high income households reduce their real housing expenditures but their incomes decline in some proportion  with their lower costs.

This is why this topic is so difficult to tease out of the data.  Average housing expenditures aren't that high in Closed access cities, by some measures I have seen, but this is because high income households in those cities have sharply reduced their real housing consumption.  The interplay between real and nominal become complex.

Friday, April 15, 2016

Housing: Part 134 - Deprivation Created Wealth

Tyler Cowen has linked to two items recently that are among the countless articles and studies that are at odds with the findings of my current research.

The first item is a link to an upcoming book by Joel Kotkin, where Tyler suggests that higher housing expenses in the cities I call Closed Access cities are somewhat inevitable and that expanded building will only draw in more high income workers.  (1) I reject that claim and (2) even if it is true, it would be an even better reason to build, because it means that the value of density is practically limitless.  Maybe this is step one to Robin Hanson's world of ems living in tightly knitted networks.  On careful reading, I don't think Tyler is saying this is a problem, per se.  He's just saying building won't lower costs.  But, even here, I think it would be quite a jump to argue that greatly expanded building in the Closed Access cities would not benefit the current residents who are being stressed by rising rents.  Even if expansion only led to more rising incomes and rising rents, the increased local market for non-tradable services would surely raise the incomes of current residents, too.  They would likely get some relief from rising incomes, even if rents didn't relent.

The second item is a link to a VoxEU article by Borio, Kharroubi, Upper, and Zampolli that is yet another in a LONG line of articles which take financial expansion as the cause of a boom, and misallocations of capital and labor as a result of that boom, which lead to busts.

I have recently received some great data from Zillow which helps to pull together some more conclusions on these matters.  (THANK YOU, ZILLOW!  One more reason Zillow rocks.  Zillow Data, much of which they publish for free at their website, has been invaluable in my study.)  They sent me data with estimates of total residential real estate market values, by MSA, going back to 1998.  I had been hoping to get something like this to confirm the total effect on national asset values coming out of the Closed Access cities.

Here are the picture pages:

As I suspected, deprivation was the source of much of the increase in real estate values, not demand-side excess.  In this first graph, the US outside the Closed Access and Contagion cities saw a rise of roughly 20% in Property Values / Income from 1998 to 2006.  Over this timeframe, real yields on 30 year TIPS fell from about 4% to about 2% - a tremendous drop for rates that usually are very stable, in a short period of time.  To give an indication of the power of this change, this caused the price of 30 year bonds to rise by 45%.  So, outside the Closed Access and Contagion cities, not only is there no evidence, in the aggregate, of demand-side excess, but there is no evidence of demand-side excess, and the response of home prices to long term real interest rates is tentative.  The market price of real estate in 2005 was very conservative, compared to a discounted cash flow valuation (before taking tax effects into account).

And, as of 2003, even the Contagion cities were in line with the other MSAs and the rest of the country.  Homes in Atlanta, Houston, and Dallas weren't even fetching a higher price relative to incomes, even with the sharply lower interest rates.

In 2003, two shifts began to happen.  Pressure on the GSEs from the Bush administration led to a sharp curtailment of conventional mortgage originations.*  And, population growth shifts downward in the Closed Access cities.

This caused migration strains in the Contagion cities.  But, notice that population growth didn't respond in the Contagion cities, so the Contagion cities began to show some of the symptoms of Closed Access.  (Keep in mind that the Closed Access cities have about 15% of the US population, while the Contagion cities only have about 5%.)  Instead of building more homes, the Contagion cities were forcing home prices to rise enough to induce a second wave of migration from Contagion cities to the rest of the country.  Yet, at the same time, Price/Income levels in the Open Access cities were falling even while real long term interest rates continued to decline.

I know this is a hard sell for a lot of people, but the sudden rise in non-conventional mortgages in 2004 and 2005 was not a product of excess demand.  It was a response to the arbitrary curtailment of conventional loans.  The price movements in the Open Access cities here should be at least as surprising to us as the movements in the other direction in the Closed Access and Contagion cities.  Two trends were pulling in opposite directions in 2003-2005.  Supply constraints in the Closed Access cities were creating a high rent refugee crisis and the high home prices from that effect were from high rents.  And demand constraints from the GSE's were already creating a negative dislocation in the rest of the country.

By 2006, we had killed demand through credit and monetary policy.  This, perversely solved the refugee crisis because an economy with fewer opportunities meant that there was less in-migration into the Closed Access cities to tap into lucrative labor markets.  They weren't so lucrative anymore.

Note what happens after 2006.  The falling relative population in the Closed Access cities levels off, and suddenly population growth in the Contagion cities (here, Riverside, Phoenix, Miami, and Tampa) notches down from their long term trend.  The bust has created a persistent dislocation.

Rents have resumed their rise, but since the bust expanded the supply problem to the whole country, now Closed Access residents have rising rents and nowhere to escape to.  As we see in the next graph, Closed Access cities have seen rising incomes over the whole period - much of which is simply routed to landlords.  Most of the country has seen incomes rise at a relatively equal pace.  Except for the Contagion cities, because we killed the construction industry, so for at least 6 or 7 years, we just sucked the life out of those economies for no reason.

The reason we have imposed this problem on them is because of this giant honking error at the center of everyone's point of view on this.  That error is that we have one housing market, and since, in the aggregate, it looked like rising prices and rising housing starts were related, we assumed the exact wrong conclusion - that both of them were caused by too much money.  But this didn't happen anywhere.  It can't happen anywhere.  The reason everyone is so mad at the banks is that we assumed something was happening that would be basically impossible.  So, we explained this incongruity with the idea that banks were massively drawing buyers into homeownership to prop up outrageous home prices.  But the thing we were trying to explain wasn't happening anywhere.

As the next graph shows, the way to make real estate in your city more valuable is to not build.  From 1998 to 2005, real estate in the Closed Access cities increased from 19% of the US total to 24% of the US total.  And they did this by NOT BUILDING.  And the Open Access cities caused their total real estate value to fall from 4.6% to 3.6% of the US total by building like crazy - their population increased from 4.9% to 5.3% during the same time.

The housing "bubble" had nothing to do with homebuilding.  The widespread presumption that misallocation of labor and capital was due to monetary excess is wrong on every count.  None of those things happened.  But, models that use those assumptions look like they are on to something, because they measure falling productivity along with the supposed misallocation.  But, the reason there was misallocation was because of the deprivation.  The reason productivity is low and construction activity appears to be high is because Closed Access policies are preventing workers from accessing highly productive labor markets.  And, since those markets are closed, the houses we can build in other cities require a lot more material inputs for the same amount of value.

So, these studies get the causation backwards and it creates a whole set of false conclusions to argue about that all have the premise wrong.

Looking back at the first graph, the truth of the matter that will be, at some level, the cause of the next recession, is that if we took the fetters off the mortgage market, it would unleash a massive resurgence of pent up real investment.  This would cause interest rates to rise.  But, even if real long term rates recovered back to their 2003-2004 levels, and even if all that new building brought rents back down to previous levels, home prices would still rise by 30% across the board just to pull back to reasonable valuations.

Before that happens there will be gnashing of teeth and general kvetching, and there will be nearly universal calls to kill the housing market again.  We need years of 2 million annual housing starts, and this can only happen with a market in equilibrium, which means much higher housing prices.  And, we aren't about to let that happen.


* This may be hard to believe, given many observers who blame the GSEs for the problem that never happened but that they think happened.  Here is one of my older posts with some details.

Tuesday, April 12, 2016

Housing: Part 133 - Housing Costs and Population Patterns

It is heartening to see attention being given to the problem in housing among a wide-range of sources.  There seems to be a growing realization that housing constraints are a fundamental source of stress in our economy.  I am hoping that this sort of thinking seeps into the general consciousness enough that it will be a sort of step into the shallows that will allow readers to consider the downstream conclusions of my book - that the housing bubble a sign of deprivation, not excess, that our attempt to address it with monetary deprivation was ruinous, and that housing constraints are
creating complex obstacles to real economic growth while exacerbating income inequality.

Today, two articles crossed my path.  First, from Zillow. (HT: MY)

The article shows how restrictive zoning rules cause rents to rise.  It also shows how restrictive zoning rules cause household size to increase.
Land-Use Regulation_Rent-1

Here is a graph on rent inflation.  One thing I found interesting here is that Austin and San Antonio both have very high (bad) scores on land use regulation, since Texas is generally good on this issue.  One idea I have been thinking about is that it simply cannot be a coincidence that, universally, innovative new-economy firms around the developed world are locating in housing constrained cities.  There has to be something that is drawing them there, and this force must be strong, because otherwise, there would be some city, somewhere, that would incubate a tech or finance industry with low local costs, and immediately draw firms to the region.  These are industries that are highly dependent on human capital, and they universally locate where the cost of living is 25% or more above everywhere else.

These are industries with very high idiosyncratic risks.  Especially in the tech industry, the most prominent firms can go from IPO to industry leader to Trivial Pursuit question in a decade, yet they must frequently raise capital for development that will only lead to profits after a long incubation period.  I wonder if there is some sort of emergent phenomenon where firms can only attract capital in such a competitive environment if there is some natural competitive moat around their business sector, and housing constraints that limit the amount of highly skilled labor that would people their potential competition happen to serve that purpose.

I tend to see these housing constraints as a source of deprivation - that if a million new tech workers could move into Silicon Valley, we would be awash in new innovation.  But, maybe that is wrong.  Maybe the only way to get the internet is to create enough competitive barriers that the risks for new firms become manageable.  Maybe fewer firms would have made the forward looking investments that have built Silicon Valley over the past couple of decades if there was more competition.

And, isn't it interesting that the one city in Texas that seems to be able to start drawing a tech presence is Austin - a city that Wharton says has California style housing constraints?

The whole idea goes against my nature.  But, how else can we interpret this?

Here is another graph from the article, showing the change in adults per household since 2011.
Land-Use Regulation_doubling over time-4


Adults per household had been declining for many years.  I suspect that this has something to do with the population patterns I have found.  One of the interesting things about population and migration during the housing boom is that population in the Closed Access cities (San Francisco, LA, NYC, Boston) was generally declining (!) during the peak building years.  I have attributed this to international in-migration, which might have increased the number of persons living in those cities without increasing the residential population.  But, I suspect that a large part of the story is this.

As housing, in the aggregate, expanded, this would have allowed household size, in general, to decline, and on the margin, in cities where these sorts of compromises must be made, there was some relief which led some individuals to substitute comfort in Phoenix for opportunity in San Francisco.  When housing is expanding, maybe this behavior on the margin can outweigh the small maximum rate of increase these cities can provide in the housing stock.
-----------------

The second article I saw today was from Pew (HT: NT) about how population growth is driven by housing constraints, and about how cost of housing is driving relocation decisions among young people.

I think that as the economic recovery lengthens, we will continue to see this pattern, where population shifts to low cost areas.  This will be the pattern of our economy until we fix this problem.  Housing constraints in our economic centers will put a lid on economic growth as recovery continues, home building in other parts of the country will begin to grow while rents and prices in the constrained cities will rise.  We will misinterpret this as a "bubble" caused by too much speculation and money.  We will bemoan the fact that the economy is broken, all the gains go to high incomes and asset bubbles, and we will suffocate it, leading to another recession.

How many times will we inflict this on ourselves before we stop blaming easy scapegoats and fix the problem.  I hope I can have some influence on that race.

Monday, April 11, 2016

Private Investment and Recessions

I saw this reference to an upcoming Auclert and Rognlie paper (HT: EV) on inequality and the business cycle.  I can't see the full paper, but the abstract says:
A temporary rise in inequality, if not accommodated by monetary policy, has an immediate effect on output that can be quantified using the empirical covariance between income and marginal propensities to consume.
This seems like a strange idea to me.  Aren't falling profits and falling private investment leading indicators of coming recessions?  If that is so, then it seems odd that a lower propensity to consume would be a causal factor in a production contraction.  Maybe the key here is the monetary policy bit.  Maybe they are using interest rates as the proxy for monetary policy, so that a model that produces a downward shift in the natural rate while stable monetary policy is defined as a fixed interest rate, would lead to contraction.  I don't know if that's what's going on, but otherwise, it seems strange.

This led me to call up this graph:

Thinking about our current context, private domestic investment, minus residential investment, actually doesn't look that bad.  It's not blowing the roof off, but after the deep drop in the recession, we have recovered to pretty typical investment levels.

If we look at the top line, which includes residential investing (or the bottom green line which is the measure of residential investment), it looks a lot worse.  The recovery level is below all other post-war recovery levels, and is still roughly at levels we would normally consider recessionary.

This is the story of this decade.  Millions of construction workers have been sidelined.  How much of the persistent cyclical downshift in labor force participation was due to our misplaced concerns about homebuilding?  Unemployment has dropped in construction during the recovery, but labor force has not recovered.  (The employment and unemployment lines are stacked.)  So, 1% of the labor force was in construction and now has either left the labor force or moved to other industries.  Meanwhile, rents are skyrocketing and residential investment remains about 1%-2% below any past levels.
 
 
Meanwhile, real GDP growth seems to be about 1%-2% below typical recovery levels.  These seem like pretty obvious dots to connect.  We shut down mortgage lending, and for a decade, we have basically put 1% to 2% of the economy on mothballs.  There is one way to fix this economy, and only one way.  But, it would require the equivalent of admitting that we shouldn't have gone to war.  These sorts of decisions are not easy to reverse.
 
Given two choices: (1) it was probably a bad idea to invade Iraq, even if Hussein was a really bad guy, or (2) maybe, in general, banks were just kind of doing their jobs, and we should have taken steps to stabilized the mortgage industry as early as 2006*.
 
Which one would a plurality of Americans more easily cop to?  The almost universal initial reaction to the idea that I would even suggest #2 is indignation.


* I would say even as far back as 2003-2004.  One of the factors that I see in the data is that the expansion of the subprime industry itself seems to have been mostly a reaction to sharp cuts in mortgage growth at the GSE's and the FHA - especially in 2003 and 2004 after Congressional witch hunts into GSE accounting practices coincide with backpedaling at both Fannie and Freddie.  The rise of subprime, itself, was a sign, not of excess, but of stress - and of both supply and demand deprivation.
 
This seems hard to believe when residential investment was so strong in 2004 and 2005.  But, residential investment was inflated because (1) Closed Access housing policies in the large metro areas pressed housing expansion into parts of the country where single units were more prevalent and units of a given value required more fixed investment and (2) the high prices of the Closed Access cities inflated brokers' commissions, which are included in the aggregate measure.  If we adjust for these things, residential investment was at normal non-recessionary levels.
 
Measures are stacked
(We can see in this graph how low multi-unit investment had moved.  A unit-for-unit exchange of expensive downtown urban condos in the Closed Access cities for single unit homes in Arizona or Texas would, on net, reduce total residential investment because more of the value would come from location - less from materials.  This substitution from metropolitan condos to McMansions in the heartland probably added about 1/4% to 1/2% of GDP to residential investment during the boom, with no net benefit to the real value of the housing stock.)


Friday, April 8, 2016

Manufacturing Employment

I saw this earlier today, but I can't find it now, to give credit. Hat tip: KPC

But, I saw this graph of manufacturing employment as a percentage of total employment.

This looks similar to age adjusted labor force participation over long periods.  The trends on these measures are surprisingly linear.

Source
What's interesting about measures like this is that they are clearly signals of progress.  Move back a century and you'd have the same trend in agricultural employment.  Yet, progress causes dislocation, so as we experience progress, we treat it as failure.  And, over 70 years or so, along the way, the supposed causes of the faux failure are debated.  Those faux causes are mostly a window into our prejudices.  Some of us would like to blame this failure (that is to say, this progress) on creeping regulations, on foreigners, on unionization, on the decline of unionization, on taxes and spending, on a lack of taxes and spending, on greedy multi-national corporations.

How much of the public conversation around finance is based on arguments about things that aren't real that we can all hang our prejudices on.  It seems unavoidable to me that this will be the case.  Complex topics lend themselves to this problem.  I don't see how any of us can avoid it.

The line between using models and heuristics to approximate the world and imposing your prejudices on complex topics is too thin to parse.

Wednesday, April 6, 2016

Hours Worked vs. Wages

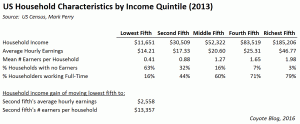
Coyoteblog has an interesting table regarding the role of hours worked vs. wages earned in total incomes.
click to enlarge
This is relevant, I think, to both the minimum wage issue and the overtime pay issue.

The regressions I did using 2 year periods before, during, and after minimum wage hikes suggested a decline in the Employment to Population ratio of about 0.17% for each 1% increase in the ratio between the minimum wage and the average wage of production and non-supervisory workers.  California and New York seem to be phasing it in, generally, at about $1 per year.  At current wage levels, that will be about a 4% rise in the MW/AW ratio per year, so that, over time, each year should cut trend EPR by about 3/4%, eventually leading to disemployment of over 3% of the population.  For states with nearly 60 million residents, this should add up to more than 2 million job losses over the next several years.

The trend in EPR is strong now, many of these displacements will be marginal workers moving out of the labor force, and most of it will be at the end of a complex series of capital allocation decisions over a period of years so that much of the dislocation will be unseen.  There is a decent likelihood that some contraction in general economic growth will confound analysis.  Maybe migration will mitigate some of the employment dislocation in the high cost areas.  With all that said, I wonder if the natural experiment aspect of this will really amount to that much, if evidence of past episodes of dislocation isn't enough to be convincing.  Although, I suspect that the fact that even the New York Times was against the minimum wage in the 1980s is because minimum wage levels were high enough at the time to tip the scales of public opinion, so maybe it is possible.