Showing posts with label LFP. Show all posts

Friday, September 2, 2016

Labor Force Participation

A while back, I did several posts on labor force participation.  My general conclusion was that LFP wasn't as bad as it was generally made out to be for several reasons:

1) The hump and decline in LFP was largely due to a combination of (1) a one-time jump in female participation from the 70s to the 90s and (2) a long term secular decline across ages and gender.

2) When looking at male participation rates over the long term, there is a pretty stable slightly downward trend, except for the 16-19 and 55+ age groups, which have idiosyncratic movements based on cultural changes, etc.

3) LFP was above trend in 2007, so that forecasts tended to (1) start too high and (2) be flat or positive, which, in hindsight, was wildly optimistic, and contrary to half a century of experience.

So, LFP was a little bit below trend after the recession - not outside of historical norms, once the trend is accounted for.  Some of the downward trend of the 45-54 group is probably related to the way our disability programs induce people in that age group to leave the labor force, but that trend has been sloping downward for decades.  The 25-34 age group may have dropped by 1% or so in a way that will persist below the trend.

Within the working age groups, it looks like LFP has, more or less, recovered to expansion levels.  The 25-34 group might have some slack left.

This leaves a bit of a mystery for me, because I have been moving to an argument that we were deceptively in a sort of full employment recessionary condition by late 2006.  But, LFP moving above trend into late 2007 contradicts that idea.  This was a strange period, though.  Some of the growth in incomes was through rent inflation - most of which is imputed rent of owner-occupiers.  But, property values were flat or declining.  So, owners weren't getting any wealth effect from their properties, and in fact some were facing losses.  Owners had higher costs and incomes in a way that they would only know because the BEA told them they did.  Renters were transferring more of their incomes to landlords.  These amount to fractions of a percent of NGDP growth in a given year, but we are also talking about fractions of a percent of labor force participation.

It seems like there is something mysterious going on in the business cycle, when contraction is focused on housing, there is an increase in nominal production and income in a category that is mostly imputed - that requires no cash.  Wages rise.  Renters pay more of those wages to their landlords.  Owners pay themselves higher rents, though they don't know it.  So, a growing part of incomes is simply transfers on sunk costs to owners.  Does this create a boost in employment in the early part of the contraction?

In the current context, is employment even more of a lagging factor than it normally is?

Tuesday, May 19, 2015

Revisiting Labor Force Participation

Tyler Cowen, linked to a post today about unemployment, which made the common insinuation that the unemployment rate has been lowered by a bipartisan conspiracy to hide the true level of unemployment.  From the post:
Before the latest recession, the proportion of people who "want a job" has been around 63% for a very long time. During the recession, this proportion plunged to below 59%.
This looks plausible next to a graph truncated in 1994 when female labor force participation was peaking and falling into a slight long term declining trend similar to male labor force participation in a post that makes no reference to these gender trends or to the significant aging issue.  But, the idea that the aggregate Employment-Population Ratio (EPR) has had some longstanding level stationarity which has suddenly failed is false.  Labor force participation (LFP = employed + unemployed, so it is less cyclical than EPR) does have longstanding linear trends for gender specific age groups.  But those trends have been slightly negative for generations among males.  So, where there are trends, they don't support the author's case.

Anyway, looking at that made me realize that it had been quite a while since I had reviewed Labor Force Participation (LFP).  We will continue to slowly converge on the long term trend, so it's not something I have been following recently, but it might be interesting to unpack it a bit to see what's been happening lately.  (My LFP label has many posts.  Here is a reaction to a previous Tyler Cowen link.  Here, I go into some more detail regarding errors in LFP analysis.)

Here is a graph of the aggregate LFP rate compared to a demographically adjusted trend.  I am surprised to see that the trend has begun to level off and that there has not been convergence between my demographically adjusted trend and actual LFP.  I had blamed the declining LFP on cyclical declines, demographics, and on the minimum wage hikes of 2007-2009, with a mitigating factor from Emergency Unemployment Insurance (EUI), since that should have been keeping some unemployed workers, who might otherwise leave the labor force, in the labor force.  There was about a 1/2% drop in LFP coincident with the end of EUI.  (This graph has a wide scale, but you can see the widening of the gap between actual LFP and trend LFP in 2014.)  But, I would have expected LFP to be recovering by that time from the cyclical and minimum wage issues.

So, the question is, why isn't there a stronger recovery in LFP?

As a first step, let's revisit the movement of LFP among the various age groups.  The 16-24 group is a bit of a wild card, because there has been significant movement over time.  I would attribute some of the 2007-2009 decline and subsequent recovery to the minimum wage hikes, but there has been a strong downtrend in this age group for many years related to trends in extended education.

The idea that 16-24 year old labor force participation is back to trend or slightly above appears to be reasonable, because 16-24 unemployment is also back to recovery levels.  Unemployment tends to be high in this group.  In April it was at 11.6%, which was the unemployment level in 1997 and 2005 when labor force participation was previously above trend.

So, the continued gap between actual LFP and my estimated trend is not coming from this age group.

Next, let's look at prime working ages.  The 25-34 group is 0.3% below trend, 35-44 is 0.8% below trend, and 45-54 is 1.3% below trend.  The gap widens as we move up through age groups.

I think the 25-44 group is straightforward.  The combined level of these two groups suggests a gap between LFP and trend LFP of around 0.5%, which, is slightly low, but not unusual for late recovery periods.

Moving on to the 55+ group, there has been a tremendous break from trend.  This group is 3.1% below trend, and the break happened around 2007-2009, which appears to be related to the cycle.

But, the 45+ age groups are a little strange.  The 55+ age groups have had sharply rising LFP trends for the past 20 years.  Part of this is due to rising LFP among men, which appears to be a cultural shift among baby boomers to work longer, unrelated to business cycles.

Part of this is due to the last remaining upward shift in female labor participation.  Female LFP for 35-44 year olds peaked in the 1990s.  It peaked for 45-54 year olds around 2000-2002.  And, we see here that it peaked for 55+ year olds in 2010-2012.

So, the leveling trend of 55+ female LFP was predictable.  So, both the leveling female trend and the recession happened at the same time that the trend of 55+ male LFP leveled.

It's hard to pin down the precise causes of the movements in this age group without much more detailed analysis.  But, the systematic behavior by gender and age, and the sharp differences between the marginal age groups and the core prime age groups, suggests to me that these changes are only tangential to the business cycle.

Here is a graph with the 55+ age groups broken out into 5 year subgroups.  This graph shows the change in labor force participation, in percentage points, from January 2000.  I think here we can see that there isn't a systematic kink in labor force behavior associated with the recession.  What we see is a peak in labor force participation that moves through the age groups roughly in line with the arrival of the baby boomers, who tend to work to older ages and tend to have higher female participation.  These tend to be very noisy data series.  But, generally, the 55-59 group peaked around the time of the recession (and some of this group's decline may be cyclical).  The older groups are still growing as life expectancy grows and as the baby boomers move into the older groups.

So, what is happening to the LFP of the aggregated 55+ group is a similar version of what is happening to the aggregate LFP across all ages.  The trends within each subgroup are continuing with a relatively normal behavior.  In these groups, the trends are actually rising.  But, as the baby boomers age through these groups, the total LFP of the aggregate 55+ group declines, because LFP declines sharply as workers age through these groups.  This is shown in the next graph.

And, this basic demographic issue also explains the behavior of the 45-54 group.  Here is that group, shown with the 5 year subgroups.  The 45-49 subgroup looks more like the 25-44 age groups.  And the 50-54 subgroup looks more like the 55-59 group.

Stepping back, the only significant factor here that looks especially out of the ordinary when we disaggregate, is the sharp dip in LFP for the 50-59 age range, which is probably explained by the rise in social security disability claims that tends to happen in this age range, and has especially been the case during the recent recession.

If this change in the trend of 55+ workers is not related to the recession, then there is no gap in LFP.  The next graph shows 55+ LFP and my original linear trend, with a new trend line added that follows the new flat trend since the beginning of 2011.

And the graph after that shows what the aggregate LFP trend looks like if we make this change in the 55+ age group trend.

Now, I haven't proven that there is no cyclical issue here.  But, if someone argues that trend LFP is some distance above the estimated trend that I show here, they would need to explain why the continued lag in LFP is limited to workers over 50 years old.

In the period from 2000 to 2014, social security disability rolls have increased from 2.4% to 3.6% of the adult civilian population.  New enrollees peaked in 2010, which is when baby boomers were at the heart of the 50-60 age group.  Disability rolls have stabilized since 2011, as baby boomers move into the 60+ age groups, so this issue is probably not as severe, going forward.  And, while there was some increase in disability enrollment that was related to the recession, this is not really a cyclical issue.  And, it's not a reason to describe the current labor market as deceptively weak.

So, I continue to believe that the labor market is as strong as popular measures make it out to be.  I don't accept the notion that strong labor markets are inflationary.  I think we can expect strong real growth that comes from a highly functional economy.  This would normally also include high real interest rates.  But, I think it remains to be seen if high interest rates can materialize in the absence of mortgage expansion.  So, while I think labor markets are strong, I don't think this necessarily translates into a call for the Fed to raise their target rates.  But, if we can find some way to overcome the real estate shortage, secular growth rates could be quite strong.

Tuesday, December 16, 2014

Changes in Male Labor Force

These charts from the New York Times are just the kind of thing I've been looking for.

Here is the static version of the chart from the article.  It would be great to see a moving version of this over a longer period of time.

I'm not sure there is much to worry about on the age groups under 50 years.  Some blame the increase in young workers not working while in school on the minimum wage.  There might have been some of that after the 2007-2009 hikes, but the minimum wage is nearly back to insignificant levels, so I can't believe it would have had that much of an effect.  And, we saw this same trend between the MW hikes of 1996 and 2007.  So, I think this is largely a cultural shift.

Between 25 and 50 years, there has been a shift to unemployment, which is cyclical and should be generally temporary.  Otherwise, there have been small shifts to disability and caring for family.

I would also attribute much of the drop in rates of retirement to cultural changes, generally from people being more productive and active at older ages.  Some attribute this to older workers lacking retirement support, but as with the young, this represents a long term shift in behaviors that has persisted through business cycles.  There is a tendency to negativity in some of these interpretations, so that lower labor force participation in 50 year olds is blamed on stagnation and higher labor force participation in 60 year olds is also blamed on stagnation.

The largest problem is the disability issue, which affects the over 50 age groups the most.  This is clearly the product of bloat in a program that has devastating moral hazard issues, and it appears to be a significant input into the decline in US labor force participation compared to other nations over the past couple of decades.  Other public programs have the problem of creating a high de facto marginal tax rate for the poorest households.  But, this policy provides a meager support level and then explicitly directs recipients to self-identify as unproductive.  Local news teams expose frauds on disability who are filmed playing in softball leagues, etc.  This is trees and forests, people.  We're the monsters that put them in that situation.  (Of course, you could say the same for banks overleveraged on AAA securities.)  I predict that this problem will not be a topic in the political theater associated with upcoming elections.

Thursday, October 16, 2014

More Amazing Stuff on Labor Force Participation from the Atlanta Fed

Here is a link to some great labor force participation data from the Atlanta Fed. (HT: EV)  Be sure to check out all the information on this page, too, including the interactive chart and the downloadable data.

Here are a couple of graphs.  But there are tons more.

I think this data generally backs up the notion that much of the decline in LFP has been age related.  I have attributed the disability problem mostly to aging, but the data here makes it clear that there has been a sharp increase in disability, even after adjusting for age.  In fact, among prime age workers, while most employment indicators are now improving, disability is still growing as a reason for dropping out of the labor force.

In the second graph I have posted here, most of the decline in Prime Age LFP in the "Don't want a job" category is due to higher disability claims.  Part of this is due to the unusually large number of 50 year+ workers in the population distribution right now.  But, part of this is due to an increase in disability claims within that age group  (Paging Benjamin Cole!).  Prime-Age includes 25-54 year olds, and much of the decline is due to more schooling at the low end of the age group and more disability at the high end of the age group.

Most of the increase in disability claims during the recession has been among the older working age population, but disability since 1999 has increased across all age groups.

Anyway, don't stop with my post.  Go to the links.  This is great stuff for data nerds.

Tuesday, October 7, 2014

Labor Force Participation by Age and Gender

Here is the infamous Labor Force Participation chart.  Next, is the chart, broken out by age and gender.  The shape disappears when we disaggregate, except that the one-time increase in the 1970s & 1980s in the female working age categories parallels the one time increase in aggregate LFP.

I estimate that after accounting for age and gender, labor force participation is between 1% and 1 1/2% below cyclically adjusted trend.  There are a few categories that don't have long-term linear behavior.  There are cultural changes in the 55+ category, which had, many years ago, been very high among men, then bottomed in the 1990s but are now increasing again as productive lifespans increase.  These have leveled out after rising, and it is hard to know whether any of this leveling is cyclical.  Most of the issue of Social Security disability benefits plays out in this age group, so my simple analysis here doesn't help to quantify that issue very much.  The 16-19 year old category has declined tremendously, also, for cultural reasons, and it displays significant cyclical movement.  It has been stabilized since 2010, and was likely affected by the minimum wage increases of 2007-2009.

The remaining categories have linear patterns that allow us to estimate their cyclical deviations.


 These are pretty noisy series, so these will be broad estimates.  Here are the high participation male groups.

The 45-54 male category has shown some significant cyclical behavior.  It has recovered and is within about 1/2% of the trendline.  The 35-44 male group had less cyclical behavior and is also near trend.

The 25-34 male group had sharp cyclical behavior and is still about 2-1/2% below trend.

The 45-54 group is probably echoing some of the long term trend among the older group, where more people are able to at least partly disengage from the labor force as we become wealthier in general.  Age 50 is a trigger year for disability benefits, so the long term decline among 45-54 year olds is probably a signal of that issue.  I think this signals that recent increases in disability claims are more a sign of boomers hitting 50+ than they are of age adjusted changes in claims.  So, I think this problem will stop drawing down the LFP trend as the boomers age.

Here is the Male 20-24 category.  Like the male 25-34 category, this group has seen a sharp cyclical decline.  It is still about 3% below trend.

The female groups are a little harder to estimate because the trends are shorter and there seems to be more noise.  I don't see any obvious cyclical drops in the younger groups (including 20-24 year olds, not shown in this graph).  It depends on where you set the trends, but as a whole, there is probably less than a 1% deviation from trend.

Aggregate LFP tends to move about 0.5% above and below trend through business cycles.  In this cycle, it may be about 1 1/4% below trend, even after adjusting for age & gender.  I think we can broadly divide this decline into three roughly equal parts:

1) Cultural changes among 16-19 year olds and 55+ year olds, which may have been affected or amplified by cyclical issues.  These changes are mostly the product of wealth and longevity, and are probably not a concern.

2) Sharp declines among men under 35 years old.  I don't think the data show a surge of college admissions among men, relative to women, so I don't think that is the explanation.  The good scenario is a leveling of gender expectations - more house-dads, etc.  The bad scenario is that there is a budding underclass of unemployable unskilled males.  It is important to keep in mind the scale here.  We are talking about maybe 2% of the males in this age group.  But, I would say that this is the category that does represent a potential structural issue that might need to be addressed or that might represent involuntary or dysfunctional changes in labor force behavior.  There has been a distinct change in young adult male working behavior coincident with this cycle.  Could this be related to the collapse in construction labor?  Cyclically, we tend to think of the lower LFP in these ages as related to returning to school during downturns.  But, over the longer term, education correlates with higher labor force participation.  Could there be a new wave of long term convergence between male & female LFP, beginning in the younger groups, that is related to the very high relative levels of higher education among young women?

3) Fairly normal cyclical behavior among the prime working age males and females.

But, there is one additional issue:

4) The labor force might be overstated by up to 0.4%-0.5% if the VLT unemployed would normally have been categorized as exiting the labor force.

Friday, August 29, 2014

Long Term Non-employment

The Financial Times has an interesting article on long term unemployment.  It is a review of this presentation at Jackson Hole by Jae Song and Till von Wachter.

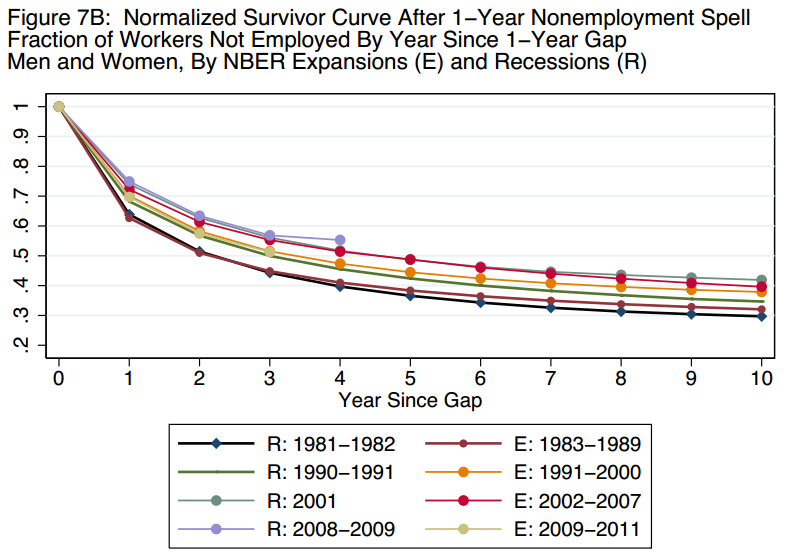
They utilize longitudinal microdata to track the employment status of displaced workers over time.  Using "non-employment" in lieu of "unemployment", they find little difference between the re-employment behavior of workers in the recent recession and workers of previous recessions.  Here is a graph of very long term non-employment persistence from the paper.  While there has been some change in the trend over time, there is little difference between recessionary times and expansionary times.  Also, there is little difference between the outcomes since 2008 and previous periods.  This is a fairly shocking finding, considering the well-known existence in the BLS's Household Survey of a large quantity of very-long-term unemployed workers.

Here is a graph of unemployment duration by age.  Keep in mind that short term unemployment durations are pretty normal now, so all of this extra average duration is coming from 1/6 of the pool of unemployed workers.  So, estimating from BLS data, it looks like about 5.2% of the labor force is unemployed in a fairly normal labor market, with average unemployment durations of less than 20 weeks.  Then, there is another 1% of the labor force that is unemployed, with an average unemployment duration of more than 120 weeks.

At first glance, these data are telling two different stories.  Here are some more graphs from the article.  First, this graph shows the fraction of the labor force that has been non-employed for one year, two years, etc.  This shows that extended unemployment was slightly worse in the 2008 recession than it had been in 1980, but not excessively worse.

The next graph (Figure 12A from the paper) shows the re-employment behavior of displaced workers in four recessions.  The recovery to employment in the 2008 recession has followed a pattern similar to previous recessions.  It is worth noting that a displacement episode appears to lead to a permanent 10% reduction in employment among the affected workers.

Finally, in the Figure 6A from the paper, we can see the surprising finding that the level of long-term nonemployment has been unusually low in the 2009-2011 period.

This suggests that much of the very long term unemployment in the current count is mostly a categorization issue related to workers whose behavior hasn't been materially different from previous recessions, but who may have been more likely to refer to themselves as unemployed in surveys because of subtle framing effects related to public labor policies, such as emergency unemployment insurance (EUI).  If that is the case, it would suggest several implications:

1) Unemployment has been overstated, relative to previous recessions.  This would apply to the approximately 1% of the labor force that currently is categorized as unemployed with very long unemployment durations.  It would also apply to the U-6 unemployment rate that includes marginally attached and part time workers.  The paper outlines how there tends to be marginal employment activity over time with long term non-employed workers, after a displacement, but that over time permanently non-employed workers become a larger proportion of the remaining non-employed.  Following this pattern, we should continue to see a reduction in U-6 unemployment.  I suppose that we might end up with a permanently self-identified population of unemployed workers, but I think it is more likely that to the extent that this group reflects the displaced workers who permanently leave the labor force, they will slowly begin to self-identify as not-in-the-labor-force.

So, if this is the case, the current unemployment rate, stated comparably to previous periods, might be in the low 5%s.  This would explain how real wages have been higher than we should have expected, given the unemployment rate.  The authors also point out that the permanently non-employed displaced workers tend to be older, which also might explain why unemployment in this recession tended to be excessively high for older age groups.

Here is a graph of employment flows.  Note that the most unusual movement in the recent recession was the unusual increase in flows between unemployment and "Not in Labor Force".  Flows between Employment and "Not in Labor Force" and between Employment and Unemployment reached levels slightly worse than the 2000 recession and about the same as the labor market in 1995 when these data series begin.  And, these sets of flows are currently back at normal recovery levels.  This would lead one to expect a business cycle where unemployment topped out in the high single digits and is back around 5%.  The outlier here is the flows between unemployed and "Not in Labor Force", which moved much higher, relative to the other flow sets, and which remain elevated.  Could this unusual movement reflect a change in self-identification and categorization among marginally attached workers who, in previous downturns, simply identified as "Not in Labor Force"?

This also comports with the recent high level of job openings and the idea that, adjusted for demographics, JOLTS indicators point to a historically comparable unemployment rate around 5.7 (which, given our current demographics would come in at around 5.3%).

2) I have been too hard on EUI.  If this paper is on to something, then EUI didn't change labor behavior significantly, so it shouldn't be blamed for the long-term unemployment problem or for significant hysteresis in the labor market.  These are workers who are mostly just being labeled differently within a fairly typical labor market behavior.  I would still argue that it might not be the most efficient redistribution program, but this paper seems to support the argument that the apparent increase in unemployment durations from EUI comes mostly from movement between "Not in Labor Force" and Unemployment, not from delays in re-employment.

To the extent that this data is informative, it might suggest that in the next downturn, an extremely generous EUI program won't necessarily be that damaging to the labor market - it will just appear to be.

These implications would all generally point to a more optimistic picture of the current economic context.  It would mean that historically comparable Labor Force Participation took a deeper cyclical dive than the reported numbers suggest.  Although, the adjusted statistic would show a dip earlier in the recession, with stronger recovery since then.  But, it also means that we are currently basically recovered and that the labor recovery was stronger and sooner than we thought it was.  Much of the remaining reductions in unemployment would typically be recorded as re-entries into the labor force.

Finally, these findings show how beneficial functional NGDP targeting could be.  There is something to be said for the creative destruction that might come out of a difficult economic period.  But, I think it's incorrect to argue for unnecessary economic disruptions.  The aggregate costs surely outweigh the benefits.  This paper points to significant permanent disemployment coming from economic dislocations.  If some of these labor disruptions are a result of suboptimal monetary policy, and if more stable nominal demand could prevent some of these dislocations, it could lead to higher labor force participation and utilization over time.  I don't think higher labor force participation should be considered a goal, a priori.  But, the permanent disemployment from these dislocations are almost certainly inefficient and are not remotely optimal for the affected workers, so in this case, it would represent improvement.


Thursday, August 7, 2014

Emergency Unemployment Insurance Post Mortem

When I originally looked at the North Carolina Emergency Unemployment Insurance topic (NC terminated the program 6 months early, in June 2013), it looked like the state experienced both strong gains in employment and some decreases in labor force participation, combining for very strong declines in unemployment.

But, when I last looked at it, after data revisions that came out in February, the unusual gains in employment disappeared in the revised data.  NC still saw very large decreases in unemployment, but they now appeared to be almost entirely from a decrease in the labor force.

This suggested that, if the same trend was going to hold for the US after the end of EUI in December 2013, we would see an acceleration in the declining Unemployment Rate, but that this would come substantially from declining Labor Force Participation.  Further, I noted that, since EUI participation seems to skew older, that to the extent LFP did dip, that decline would come in the older age groups.  The decline in LFP that happened earlier in the recession skewed younger, and we should see this LFP in the younger ages recover or level out, even as EUI ended.

The July employment report seems like a good place to review the data and see what has actually come to pass.

Here are the national labor force participation and employment-population ratio from 2011.  These results look similar to the original pre-revision North Carolina data.  There has been a strong rebound in EPR since the end of 2013, and LFP has dipped slightly from trend.  The dip in October 2013 was related to the government shut down, so it is a little difficult to identify the causes, but LFP has fallen below trend at a point in the cycle where we would expect it to start recovering cyclically.  (Note, I just placed the trend lines in the graph manually, with the LFP decline approximating the demographic decline I have found in other analysis.)

Here, I break out LFP and EPR by age group.  I use weighted moving averages to clean up the noise a little bit.  Here, we can see that, within the age groups, generally, LFP had turned down for most of 2013, and has flattened out in 2014.  EPR had flattened out in 2013 after recovering in 2012.  This is odd, since GDP improved in 2013, compared to 2012.  But, across age groups, there has been a distinct shift upward in both LFP and EPR in 2014.  In a previous post, I noted the unusual rise in unemployment rates for workers above 45 years old during the EUI program.  There was a skew to older workers in EUI, and I think here we can see a slightly sharper change in the 45-54 age group in LFP and EPR.  But, whatever is affecting labor markets, whether EUI or the myriad other factors, the bulk of the effect is across age groups.

I don't think we can attribute the drop in LFP in 2013 to the impending end of EUI because there was not an unusual decline in EUI beneficiaries in the months leading up to the termination of the program.  So, this data gives an even more positive picture of employment trends coincident with the end of EUI than the original data did at the end of the program in North Carolina.  And, given that this data comes out of the Current Population Survey, it won't be revised.

On another topic, which I hope to visit soon in another post, this should tell us something about potential unemployment numbers moving forward.  There is a lot of sandbagging on unemployment forecasts because of the expectation that workers will be moving back into the labor force, so that even though employment might increase, the unemployment rate will moderate.  But, as we can see here, a strengthening trend in LFP has already been happening while the rate of decline in the unemployment rate has been accelerating.

In past cycles, there have been times where an increase in LFP coincided with a flattening in the trend of the unemployment rate.  But, this has tended to happen at full employment levels.  With slack in the labor market, I expect to see a continued comovement in these measures.  There are complementarities within the economy that, in a context that isn't constrained by capacity in the labor market, could mean that increasing LFP is actually partly responsible for the accelerating decline in the unemployment rate.  If this is the case, there could be some significant positive surprises ahead in both employment and GDP.

Thursday, June 12, 2014

Labor Force Participation for "Prime Age Workers"

Bill McBride has a great piece on labor force participation for "prime age workers".  This is referring to workers 25-54 years old.  There is some tradition in using this indicator.  But, the fact of the matter is that LFP rates for 25-29 and 45-54 year old workers is lower than it is for 30-44 year old workers.  All the lowest participation age groups within this set are unusually populated right now.  The decline in prime age worker LFP is still capturing a lot of demographic factors.  Breaking LFP out in 5 year baskets, all of these age groups generally follow long term trends, except for the 25-29 year old male category, which has an unusual decline of about 2% over the past decade.  So, we can debate what is happening with 20-somethings, but this just isn't a story about 41 year olds.  The thing is, the data to clarify this error is readily available.  There is no excuse for making this mistake.

I think generally what is going on here is that the "prime age workers" category is a source of data that is seemingly credible but is currently providing a false signal for LFP pessimism.  Frankly, I think an article using "prime working age" to make pessimistic points about LFP mostly just informs the reader of two things.  (1) The author has a preconception that LFP has been especially bad and that the unemployment rate understates problems in the labor economy, and (2) the author hasn't taken some very basic disciplined steps to check their preconception.

I don't mean to be too harsh.  This is an example of how difficult analysis of the economy is.  We are all engaged in a battle against our own self-dealing misconceptions and lack of understanding.  If we're lucky, we might occasionally find a window into the chaos that gives us a slightly less misinformed viewpoint.

from Sober Look
In fact, here is an excellent post pointing to my possible ignorance, from soberlook, that makes a strong case that the US labor force participation has a real problem that isn't just about aging demographics.  Here are a couple graphs from the article.  The Canadian comparison is very compelling, although the case there does not look like it's a cyclical issue.  Canada has been on a different trend than the US for nearly 20 years.  I suspect that this points to our disability program that locks people into dependence.  Nearly 9 million, or almost 4%, of adult Americans are on disability.  Canada doesn't even have a national level program, from what I can tell.

This could be pulling the labor force participation levels down for 50-65 year olds in the US in a way that makes demographics much more of a dampener here than it is in Canada, without appearing in the age group data as a significant deviation from trend.

Here are comparisons of male labor force participation that I found at Fred.  Much of the gap appears to be coming from the older age group that is most heavily affected by disability programs in the US.  Participation is actually growing in this group, but not as sharply as in Canada.


from Sober Look
Another graph from their post appears to show a sharp change in trend concurrent with the recession among workers with less than a high school diploma, but the level of participation is significantly higher than it was anytime before about 2004.  This data only goes back to 1992.  It begins at about 41-42%, declines slightly, then begins climbing in the mid-1990's, until the recession.  I wonder if these trends relate to Welfare reforms during the Clinton presidency and recent changes in Federal social policy that may have added frictions in low wage and marginal labor markets.

The change in trend among less than high school workers is sharp enough that there is probably some policy or cyclical issue at work, but this could be similar to the disability issue, in that this is a category deceptively influenced by baby boomer demographics.  Here is a graph of educational attainment over time from this article.  This category is skewed toward older workers, so this is not a measurement that we would expect to be stable over time.  This peak in LFP for this category could mostly be a product of a mass of "less than high school" workers reaching ages that peaked in typical LFP in the 2000's.  Actually, thinking about it, this is probably much more of a factor than policy issues.  Less than high school education level is fairly stable at around 11% for all age groups under 65 years.  But, for 65+, it's about 19%.  So, as there is generally an age-related decline in aggregate LFP, this group should have been seeing more of a demographic decline, since there is an especially large number of these workers who are now over 65.  I'm surprised that LFP in this group didn't begin declining earlier.  And, I would expect the demographic factor to be largely baked in at this point.  If this is simply demographics, we should see this group's LFP stabilize.

I still think a careful look suggests structural issues over cyclical ones, although even if the issue among the less than high school workers is structural, the structural and cyclical issues are intertwined.


Friday, May 2, 2014

April Employment and EUI

Previously I had modeled long term unemployment by comparing long term unemployment durations to short term unemployment durations.  Here I have modeled long term unemployment rates as a linear combination of the shorter duration unemployment rates, to compare the results to the other model.  The results turn out to be similar.

Here is the 66 year history of the model.  The specification is based on the relationship from 1948 to 1991.  The deviations of the model in 1992 and 2002 coincide with the previous two recessions and the previous two EUI episodes, which were much less generous than the recent episode.

Next is the difference between the modeled Long Term Unemployment Rate (over 26 weeks) and the actual LT Unemployment Rate.  This is similar to the numbers I have arrived at through other methods.  And, I believe the story is similar for the current labor market.  The very long term unemployed seem to have a linear behavior that is not related to EUI policy at this point, because this group had probably mostly already timed out of the program.  As with my previous estimates, this estimate suggests that this group is shrinking by about 0.05% of the labor force each month.  So, if this continues, the unemployment rate should continue to decline by about 0.6% over the next year.

I think that this method does help show how the end of EUI has filtered through to recent declines in the unemployment rate.  Beginning in the fall of 2013, unemployment durations of 5 to 26 weeks acquired a new, sharply declining trend, which has continued through April.

Durations from 15 to 26 weeks might continue to decline by about 300,000 (about 0.2%) over the next few months, but that would bring it near to probable trough levels.  These recent declines in short term unemployment should filter through to long term (>26 week) unemployment, with 0.1 - 0.2% in future declines already in motion and another 0.2 - 0.3% decline possible if the 15-26 week category continues to decline.

I think this realistically adds up to declines by the end of 2014 of about a 0.4% UE decrease from the VLT group and another 0.4% UE decrease from the trends that began in late 2013 in shorter duration categories and the expected declines those trends should produce in the long term category.  That puts us at 5.5% unemployment by the end of 2014.

It is possible that these trends will dissipate, but there is no evidence of that happening now.  And there might be some snap-back from the April number, but I don't see any reason to expect anything above, say 6.4%, even figuring on some noise over the next couple of months as the downtrend continues.

Labor Force Participation

The Employment to Population Ratio has shown some slight momentum over the past couple of years, but labor force participation continues to show weakness.  This doesn't quite fit with my amended theory of the EUI.  I would have expected some weakness coming out of EUI as some relatively small proportion of long-term unemployed would have exited EUI by exiting the labor force.  However, if there is this bifurcation among long term unemployed, and if the end of EUI didn't really affected the behavior of the very long term unemployed, I wouldn't have expected there to have been much LFP weakness.  If the end of EUI mostly caused an exit from unemployment among unemployment durations of, say, 5 to 40 weeks, I would have expected a smaller portion of those beneficiaries to have left the labor force.  But, there does seem to be some weakness in LFP coincident with the end of EUI.

We might continue to see more of this weakness over the next few months before LFP finally settles back into a direction parallel to (or reverting to) the demographically adjusted trend.

Friday, April 11, 2014

Employment Flows

 Just poking around employment flows some more, and I thought I'd share some of the patterns I see.

In the first graph, which shows all the main flows since 1995, we can see three pairs of flows that tend to move together:
Flows between employment and not-in-labor-force (NLF)
Flows between employment and unemployment
Flows between unemployment and NLF.

These pairs basically move in proportion to the number of workers in the common category.  So, flows between E and NLF move up and down with the employment rate.  Flows between U and E move up and down with the unemployment rate.  And, flows between U and NLF move up and down with the number of workers marginally attached to the work force.

What we currently have is the E/NLF and the E/U flows basically back at levels we would see during the mature phase of a recovery.

The one pair that is not healthy is the U/NLF pair, reflecting the large number of workers who are marginally attached to the labor force.  How this recovery phase matures comes down to how this pair of flows behaves.  The trend will definitely be down for both directions of the flow.  The thing to watch will be how quickly it trends down, together with the relative movement of each flow in the pair.

There seems to be some acceleration down, which I would have expected after the end of EUI, but the acceleration downward has come from U to N movement.  I would have expected it to come from N to U movement.  The best case scenario here, which I think there is some hope for, is that N to U flows decline quickly to catch up to recent movement in the U to N flow.  If that happens, the unemployment rate will drop quickly.  Everything is moving in a healthy direction now, so there doesn't appear to be a scenario in the wings that reflects a slowdown in the recovery.

The last graph is looking at the net difference between the opposite flows in each of the flow pairs.  Here we can see that there tends to be a circular flow from NLF to Unemployment to Employment back to NLF - on net.  All three net flows tend to move cyclically, and it seems to me that when all three net flows are declining, this could be a useful leading indicator for a coming recession and labor market hiccup.

Here also, I believe is evidence for my claim that the portion of the decline in the labor force participation rate (LFP) that we can attribute to cyclical factors is as much a product of an unusually high LFP in 2007 as it is of an unusual decline in 2009 & 2010.  There was a little bit of both.  But, the strong net flow from N to E throughout 2005-2007 relative to the flow from U to N, looks like a sign that there was significant opportunistic employment during that period for marginally attached workers.  So, the net flow to NLF we see in 2009-2010 is partially just an unwinding of this opportunistic cyclical employment.

In very recent flows, there is evidence again of unusually high flows from NLF to E.  This is likely to reflect some noise in the data.  But, if this proves to be persistent, it could reflect coming positive pressures on employment, wages, production, interest rates, etc.

PS:  One final graph, showing the relationship between the unemployment rate and the level of continued regular unemployment claims, with beginning and end of EUI noted in each cycle.


Friday, March 28, 2014

North Carolina Employment Update

This is an update of some of my previous posts on the North Carolina employment trends since they prematurely terminated Emergency Unemployment Insurance.  We finally have numbers through February, and there have been extensive revisions.

Here are some graphs:

The revisions have lowered the North Carolina Unemployment Rate from the summer of 2013 by more than 1/2 a percentage point.  The net result is that, even with the revisions, NC still shows very strong declines in unemployment.  But, the revisions remove most of the relative improvements in NC employment since last summer, suggesting that more of the net result of ending EUI has been a movement from unemployment to not-in-the-labor-force instead of to employment.

These large revisions show just how noisy this data is, so that there is always some question about the validity of the statistical evidence.  Evan Soltas has more on that here.

I expected to see more of a transition from unemployment to employment, as opposed to leaving the labor force, and I would have hoped for that.  In either case, if a similar trend ensues from the end of EUI at the national level, we should be left with an unemployment rate well under 6%.  It would be one thing if, in a worse case scenario, a million workers left the labor force and the unemployment rate was at 9%.  But, the tenor of this potential outcome is different when the resulting labor market is near levels we associate with full employment.

This is a place where the mistaken pessimism about labor force participation muddies the picture, because the response I see to this is that unemployment would be much higher than 6% if not for the flight of workers from the labor force.  Once we account for secular trends, the labor force, while somewhat depressed, is within the historical range.  Below, I have included a graph of LFP for the 3 male age groups with long-term linear trends.  The 25-34 age group is the only age group that is significantly below the 60 year linear trend, and even that group is only 1.2% below the trend.  On the whole, the LFPs compared to the trends are similar to where they were in 1994 and 1995, coming out of the 1991 recession.  The unemployment rate in January 1994 was 6.6% and it was 5.5% in December 1994.  EUI was terminated in the first few months of 1994, and had been much less generous than the recent version of EUI.  One caveat is that the LFP's might decline more as we exit EUI, so we might see some more deviation from trend.  I believe that EUI beneficiaries trend older, so I would expect the 25-34 group to continue to recover relative to trend, and for dips in LFP over the next few months to come in the 45-54 year old group.

The end of the program should be disinflationary, which should add to the challenge of where inflation will be over the next year, in the face of the end of QE.  On the one hand, more monetary stimulus might help move former EUI recipients back into the labor force.  On the other hand, to the extent that a number of the long-term unemployed might have marginal quantities of savings, and associated fixed incomes, unexpected inflation would reduce their real incomes.  If this is the mechanism that pulls them more aggressively back into the labor force, it might be beneficial for national production, but not necessarily beneficial for the households in question.