Showing posts with label EUI. Show all posts

Thursday, January 8, 2015

December Employment Preview

I don't have much to say about this anymore.  Here is the comparison I have been using between insured unemployment and total unemployment.

It looks like my simple forecast for total unemployment has been a little optimistic for the past 6 months.  I suspect that the employment gains we saw coming out of the end of extended unemployment insurance at the end of 2013 were mostly played out by about June, and that very long term unemployment and some of the unusual shorter term unemployment will be somewhat persistent, which seems to be a pattern in the insured vs. total unemployment relationship over the long term.  I thought that the trend in very long term employment would continue its linear fall, but this may have leveled off.

Insured unemployment also seems to finally be leveling out.  It had declined to very low levels.  At this point in the pattern, in the past 3 recoveries, insured and total unemployment rates have declined very slowly for several more years.  (Visually, in the graph, they continue to follow the same trajectory, but with less decline.  The dots, representing months, are closer together.)  So, the signal from the employment market is that the recovery is at the early stages of maturity.  I would expect the unemployment rate to meander around down through the mid-5%'s through 2015, with some noise along the way.

The first graph here is my regular graph.  The second graph is a close up view.  I have added a second forecast line, which assumes that the unusual decline in unemployment from the end of EUI ends in June.

The third graph is the longer view, smoothed.  The relationship has a counterclockwise movement through the business cycle.  The slope of the relationship is fairly consistent during downturns.  After the counterclockwise movement through the recovery, insured unemployment rises in the next downturn.  The level of unemployment when that rise ensues appears to be related to the scale and timing of previous cycles.

I don't expect to see any sudden movements or speculative opportunities coming out of employment numbers for a while.

Friday, December 5, 2014

Hysteresis in unemployment

The scatterplot of unemployment with insured unemployment gives visual evidence of the persistence of unemployment and the long term damage done by labor disruptions.  Here is the plot since 1971, first in raw monthly numbers, then in trailing 12 month moving averages.

We can see that unemployment remains elevated after each event.  Unemployment was relatively low during the 1975 disruption.  But, the recovery only lasted 5 years.  When the next disruption hit in 1980, unemployment was still elevated.  Then, the labor market was disrupted again in 1982, and unemployment, relative to insured unemployment, rose far from the normal range.  The labor market stalled in 1985-1986, but a full-scale disruption was avoided, so relative unemployment continued to slowly decline over time.

The next disruption happened in 1992, after a full 10 years of recovery, so the relative level of unemployment had fallen back into the normal range, but was still high.  The following recovery was 11 years long, so that by 2003, the level of unemployment, relative to insured unemployment, had fallen to below the level of the early 1970's.

Normal UE = total UE predicted by short term UE
Then, I think we see two things going on in the disruption of 2009.  First, since the recovery was only 6 years long, relative unemployment hadn't fallen back to its 2003 level, so the level of unemployment was slightly higher than the trajectory it followed in 2003.  Second, pro-cyclical policies - mainly very long-term unemployment insurance - led to an unusual number of reported very long-term unemployed persons.  We can see this in the third graph, where the level of total unemployment is reliably predicted by short term unemployment until the recent disruption.

At this point, the excess unemployment, relative to insured unemployment, is roughly divided in half.  Half of it could be related to the shortened business cycle that has led to a persistent increase in uninsured unemployment, similar to the 1980s, which appears to slowly decline as the business cycle lengthens.  The other half appears to be related to the unique feature of very long-term unemployment, regarding which there is no American precedent with which to anchor our expectations.

Given these factors, and given that exit rates from short and medium term unemployment should now be unaffected by EUI policies, monthly employment reports will have somewhat less importance, going forward.  Regular unemployment is roughly 5.0% now, and should slowly decline to 4.0% or even less if we can manage to maintain the recovery for another, say, 5 years.  The other approx. 0.8% of reported unemployment is very long term, and presumably marginally attached to the labor force.  While it's decline has been fairly linear for 2 to 3 years, at a rate that would burn it off by early 2016, its further decline and the destination of the workers who are leaving the category, may be difficult to track and may be only tangentially related to other factors at work in the economy.

I may focus less on monthly employment as a result.

Tuesday, September 30, 2014

Framing is everything: Unemployment Insurance Edition

Josh Bivens at EPI has posted an epilogue on EUI titled Historically Small Share of Jobless People Are Receiving Unemployment Insurance.  (Hat Tip: Economist's View, where the post is titled "The Shrinking Social Safety Net...") He starts:
Unemployment insurance (UI) is a crucial component of the American social safety net, but since 2010, the share of unemployed workers receiving UI benefits has eroded to one of its lowest points in decades.
He concludes:
Between stubbornly long average durations of unemployment spells and cutbacks in UI at both state and federal levels, the recipiency rate dropped sharply in 2012 and 2013. Then the Emergency Unemployment Compensation (EUC) program that was signed into law in the middle of 2008 expired at the end of 2013, and Congress failed to extend it.
Here is the graph:
 
 
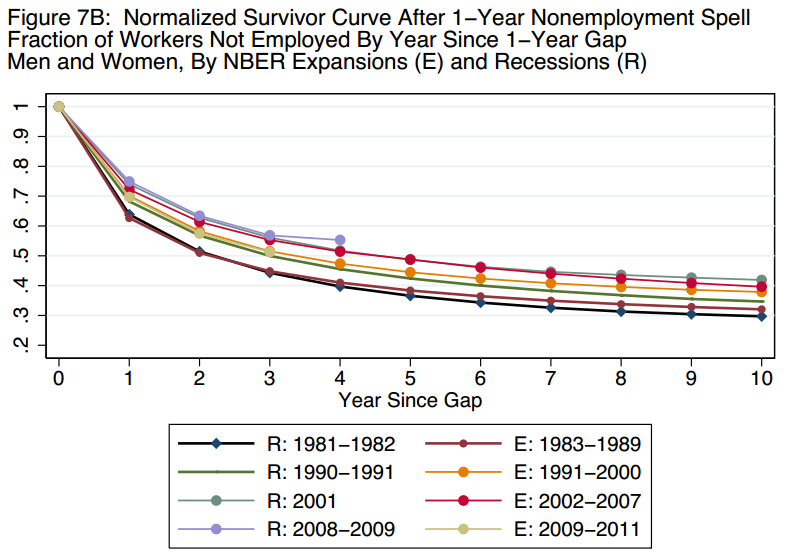
Lengthened unemployment durations are known, fairly uncontroversially I thought, to be a product of unemployment insurance.  From Laurence Ball's 2009 paper:
One story is that a decrease in aggregate demand initially causes a rise in short-term unemployment, but this turns into long-term unemployment if the slump continues. The initial short-term unemployment causes inflation to fall, but then inflation stabilizes. At that point the NAIRU is higher because of the large pool of long-term unemployed. This story is lent plausibility by evidence (in both my 1997 and 1999 papers) that a long duration of unemployment benefits magnifies hysteresis.
That kind of sounds like now.  Here is the 1997 paper from Ball, where he finds that many labor market distortions may be overstated, but that extensive unemployment insurance together with tight monetary policy, seems to lead to long term unemployment.

Here is a discussion by Paul Krugman, in 1994, that describes the sharp tradeoff between unemployment and wages, especially when wages are increasingly divergent, with policies like employer health and other mandates, minimum wage hikes, and generous unemployment insurance, leading to higher unemployment.

So, it seems odd to me that much of the public support for extended unemployment insurance simply ignores this problem.  And the implication of articles like the EPI article and Thoma's reference too it is that extended unemployment insurance (EUI) has been stingy.  While there have been states, especially in Europe, that have had UI policies more generous than recent US policy, the plain fact of the matter is that recent US policy has been much more generous than any previous US policy, and that the shape of the current labor market is reflective of this generosity.  As a prerequisite to a serious discussion, surely we must agree on this, and then address the balance between generosity and recovery.

The Evidence from 2008

Here is a graph of the unemployment rate, superimposed onto a graph of the ratio of continued claims to initial claims.  This ratio is a rough measure of the difficulty involuntarily unemployed workers have returning to employment.

Note that in the previous two downturns, EUI was not implemented until continued claims had risen for more than a year, and then plateaued.  In the recent downturn, EUI was implemented by President Bush in July 2008, very early in the cycle, before unemployment durations were particularly long.  Also, we must remember, that the Federal Reserve was explicitly pushing a disinflationary policy at the time.  In fact, none other than Janet Yellen, at the fateful September 2008 FOMC meeting (which happened after the Lehman Brothers failure and before the 4th quarter CPI collapsed to a SAAR of -8.85%), agreed with the consensus view that the Fed Funds Rate should be kept at 2%, and that with an inflation target of 2%, over/under risks were roughly balanced.
Furthermore, we have seen a remarkable decline in inflation compensation for the next five years in the TIPS market. I would not rely heavily on this decline to support my view, but I do have to say that the decline is a lot more reassuring than the alternative. I was also encouraged by the 30 basis point drop in long-term inflation expectations in the most recent Michigan survey. I anticipate that the recent jump in the unemployment rate will place some additional downward pressure on growth in labor compensation, which has been quite low, and in core inflation.
Although the jump in the unemployment rate probably partly reflects the extension of
unemployment insurance coverage, a back-of-the-envelope calculation suggests that the upper bound on this effect is just a few tenths of a percent. (pg. 34)

So, in September 2008, the FOMC was reassured by falling inflation expectations, after EUI had already begun, and EUI itself became an input into tighter monetary policy.

The labor market subsequently froze up.  We can see in the graph above how continued claims spiked to extremely high levels, but then roughly followed the path of previous recessions.  Long term unemployment is a poor signal for EUI because of the circular causation.  By 2012, as signaled by the behavior of regular UI, labor markets were back to where EUI had been discontinued in previous recessions.

So, EUI was more generous than ever before, it was implemented sooner and kept longer than in any previous cycle, and it was implemented while the Fed was pursuing tight policy (not only in 2008, but arguably when it discontinued QE1 and QE2).

Measures of Unemployment Insurance

Here are some graphs to supplement the EPI graph.

The first graph shows UI as a proportion of Labor Force, instead of as a proportion of unemployment.  The second graph is a reproduction of the EPI graph, but with UI subdivided between regular UI and EUI.  The third graph further subdivides the EPI graph, so that it shows regular UI as a proportion of UI eligible unemployment (less than 26 weeks) and EUI as a proportion of EUI eligible unemployment (more than 26 weeks).

In late 2013, the proportion of all unemployed workers who were on EUI had fallen to about 12%.  EPI implies that this was due to stingy policy.  But, we can see that coverage was declining in spite of the fact that EUI was still nearly twice as generous as in previous cycles (a max. of 47 additional weeks compared to 26 weeks).  Coverage was basically back to historical recovery levels in late 2013, even as generous benefits continued.

Why was coverage so low?  Because by 2013, the labor market was divided between a regularly functioning market, where few newly unemployed workers were experiencing durations above 26 weeks, and a small group of very long term unemployed workers who had outlived the unprecedented level of EUI benefits.  Exits from long term unemployment have accelerated since the end of EUI, so that, if we still had 73 weeks of total coverage, EUI would be covering less than 1 million workers.

There is probably no amount of time extensions that would be able to pull EUI coverage back to the coverage levels we have seen at the height of these three cycles.  There just aren't that many workers left who would be eligible for EUI, even if it were available for 4 years.  The total number of long term unemployed, whether eligible for UI or not, is now about 30% of total unemployment and is below 2% of the labor force.

Short term UI behavior is well into recovery mode.  Newly unemployed workers are dealing with an employment market that would never have been remotely considered fitting for an EUI policy.

So how does EPI find such a low recipiency rate?  Because the denominator they are using (total unemployment) includes about 1.2 million very long term unemployed workers, many of whom timed out of EUI some time ago, and who have unemployment durations of well over 2 years.  Any honest review of this policy would need to start with the question, "How much of this long term unemployment problem is a product of aggressive EUI?"

Considering monetary policy and the behavior of the labor market seen in my first graph, one has to wonder.  How much of that spike in UI coverage in late 2008/early 2009, followed by the stubborn persistence of very long term unemployment in 2010 and after, was a product of the combined monetary/EUI policy?  I don't have the precise answer to that question.  But, surely that is the question to ask.  "Did the negative side effects of tight money and generous EUI outweigh the positive benefits of the generosity?"

Unfortunately, it sounds to me like broad segments of the American electorate are under the impression that EUI is simply stimulus, because it transfers cash from savers to spenders (I'm not even going to get into that here).  It looks to me like, when the next critical moment comes, the consensus view will be to have even tighter monetary policy and more generous EUI. 

Conservatives seem to generally support tight monetary policy, along with many libertarians.  Progressives are torn.  Some think we should have looser monetary policy.  Others think we should have tighter monetary policy.  They also can't decide if conservatives are stupid or evil, though they are sure it is one of the two.  (Progressives that argue for tight money get a double whammy.  Conservatives are evil, so they secretly want to help the rich at the expense of the poor, but they are also stupid, which leads them to support tight money.)  Of course, since looser money (2%-4% inflation or 5%+ NGDP growth) would actually benefit pretty much everyone, most of all unemployed workers, these positions achieve an Abbott & Costello level of confusion.

Meanwhile, while progressives use EUI as a shaming cudgel, as in this EPI post, EUI was passed in 2008 with near unanimous Congressional support and a Republican president.

These days, we all know how desperately wrong everyone else is, but self-destructive governance seems to have safe bi-partisan support.

Friday, August 29, 2014

Long Term Non-employment

The Financial Times has an interesting article on long term unemployment.  It is a review of this presentation at Jackson Hole by Jae Song and Till von Wachter.

They utilize longitudinal microdata to track the employment status of displaced workers over time.  Using "non-employment" in lieu of "unemployment", they find little difference between the re-employment behavior of workers in the recent recession and workers of previous recessions.  Here is a graph of very long term non-employment persistence from the paper.  While there has been some change in the trend over time, there is little difference between recessionary times and expansionary times.  Also, there is little difference between the outcomes since 2008 and previous periods.  This is a fairly shocking finding, considering the well-known existence in the BLS's Household Survey of a large quantity of very-long-term unemployed workers.

Here is a graph of unemployment duration by age.  Keep in mind that short term unemployment durations are pretty normal now, so all of this extra average duration is coming from 1/6 of the pool of unemployed workers.  So, estimating from BLS data, it looks like about 5.2% of the labor force is unemployed in a fairly normal labor market, with average unemployment durations of less than 20 weeks.  Then, there is another 1% of the labor force that is unemployed, with an average unemployment duration of more than 120 weeks.

At first glance, these data are telling two different stories.  Here are some more graphs from the article.  First, this graph shows the fraction of the labor force that has been non-employed for one year, two years, etc.  This shows that extended unemployment was slightly worse in the 2008 recession than it had been in 1980, but not excessively worse.

The next graph (Figure 12A from the paper) shows the re-employment behavior of displaced workers in four recessions.  The recovery to employment in the 2008 recession has followed a pattern similar to previous recessions.  It is worth noting that a displacement episode appears to lead to a permanent 10% reduction in employment among the affected workers.

Finally, in the Figure 6A from the paper, we can see the surprising finding that the level of long-term nonemployment has been unusually low in the 2009-2011 period.

This suggests that much of the very long term unemployment in the current count is mostly a categorization issue related to workers whose behavior hasn't been materially different from previous recessions, but who may have been more likely to refer to themselves as unemployed in surveys because of subtle framing effects related to public labor policies, such as emergency unemployment insurance (EUI).  If that is the case, it would suggest several implications:

1) Unemployment has been overstated, relative to previous recessions.  This would apply to the approximately 1% of the labor force that currently is categorized as unemployed with very long unemployment durations.  It would also apply to the U-6 unemployment rate that includes marginally attached and part time workers.  The paper outlines how there tends to be marginal employment activity over time with long term non-employed workers, after a displacement, but that over time permanently non-employed workers become a larger proportion of the remaining non-employed.  Following this pattern, we should continue to see a reduction in U-6 unemployment.  I suppose that we might end up with a permanently self-identified population of unemployed workers, but I think it is more likely that to the extent that this group reflects the displaced workers who permanently leave the labor force, they will slowly begin to self-identify as not-in-the-labor-force.

So, if this is the case, the current unemployment rate, stated comparably to previous periods, might be in the low 5%s.  This would explain how real wages have been higher than we should have expected, given the unemployment rate.  The authors also point out that the permanently non-employed displaced workers tend to be older, which also might explain why unemployment in this recession tended to be excessively high for older age groups.

Here is a graph of employment flows.  Note that the most unusual movement in the recent recession was the unusual increase in flows between unemployment and "Not in Labor Force".  Flows between Employment and "Not in Labor Force" and between Employment and Unemployment reached levels slightly worse than the 2000 recession and about the same as the labor market in 1995 when these data series begin.  And, these sets of flows are currently back at normal recovery levels.  This would lead one to expect a business cycle where unemployment topped out in the high single digits and is back around 5%.  The outlier here is the flows between unemployed and "Not in Labor Force", which moved much higher, relative to the other flow sets, and which remain elevated.  Could this unusual movement reflect a change in self-identification and categorization among marginally attached workers who, in previous downturns, simply identified as "Not in Labor Force"?

This also comports with the recent high level of job openings and the idea that, adjusted for demographics, JOLTS indicators point to a historically comparable unemployment rate around 5.7 (which, given our current demographics would come in at around 5.3%).

2) I have been too hard on EUI.  If this paper is on to something, then EUI didn't change labor behavior significantly, so it shouldn't be blamed for the long-term unemployment problem or for significant hysteresis in the labor market.  These are workers who are mostly just being labeled differently within a fairly typical labor market behavior.  I would still argue that it might not be the most efficient redistribution program, but this paper seems to support the argument that the apparent increase in unemployment durations from EUI comes mostly from movement between "Not in Labor Force" and Unemployment, not from delays in re-employment.

To the extent that this data is informative, it might suggest that in the next downturn, an extremely generous EUI program won't necessarily be that damaging to the labor market - it will just appear to be.

These implications would all generally point to a more optimistic picture of the current economic context.  It would mean that historically comparable Labor Force Participation took a deeper cyclical dive than the reported numbers suggest.  Although, the adjusted statistic would show a dip earlier in the recession, with stronger recovery since then.  But, it also means that we are currently basically recovered and that the labor recovery was stronger and sooner than we thought it was.  Much of the remaining reductions in unemployment would typically be recorded as re-entries into the labor force.

Finally, these findings show how beneficial functional NGDP targeting could be.  There is something to be said for the creative destruction that might come out of a difficult economic period.  But, I think it's incorrect to argue for unnecessary economic disruptions.  The aggregate costs surely outweigh the benefits.  This paper points to significant permanent disemployment coming from economic dislocations.  If some of these labor disruptions are a result of suboptimal monetary policy, and if more stable nominal demand could prevent some of these dislocations, it could lead to higher labor force participation and utilization over time.  I don't think higher labor force participation should be considered a goal, a priori.  But, the permanent disemployment from these dislocations are almost certainly inefficient and are not remotely optimal for the affected workers, so in this case, it would represent improvement.


Saturday, August 16, 2014

EUI, Homeownership, and Wages (updated)

Here is a graph I have shown before.  This has been hidden by low levels of inflation and the broad tendency to view wages as a moral indicator, with higher always being better.  But, in this recession, wages have been very high, considering the level of unemployment we have had.  Since 1967, there has never been a sustained deviation from the trend like this.  This is problematic because unemployment in a recession is, in part, a product of inflexible nominal wages.  Employment would recover more quickly if wages were more flexible, which we normally alleviate through moderate inflation, which allows real wages to moderate without causing nominal wages to moderate as much.  So, some of this may be a product of tight monetary policy, which has allowed inflation to remain very low.

Here is a long-term comparison of measured Average Wages, compared to the average wage we would have had if real wage growth did have a perfectly linear relationship to the unemployment rate (the trendline above).  The trend here is based on the linear regression from 1967-1999, so real wages stayed very near the trend for 9 years out of sample.  Over time, actual wages moved along with expected wages with very little deviation, until the fall of 2008.  Then, actual wages deviated significantly from predicted wages, and have remained high throughout the recession.


Nominal Dollars
I created a new Expected Average Wage series by using the Unemployment Rate minus Emergency Unemployment Insurance (EUI) recipients.  Average Wages are still a little higher than this series would have predicted, but this bridges much of the gap.  With that adjustment, there was a one-time deviation between expected and actual wages between the fall of 2008 and the end of 2010.  The rise in real wages here might be from the contraction in PCEPI, as the timing coincides with the demand shock of 2008 and the beginning of QE2.

These graphs might help to highlight some of the potential tradeoffs of this policy.  Of course, we would hope that monetary policy would allow the economy to proceed without having to make these nominal adjustments.  But given the monetary policy we have, it seems to be adding insult to injury to create policies that explicitly create wage rigidity.

I'm not talking simply about there being a problem of potential workers not lowering their reservation wage enough to become reemployed.  I am sure that this effect is there.  But, as we can see in persistence, both of high relative wages and of unemployment, there has been a lingering problem of market disequilibria.  The larger problem here is the destruction of information.  The wage levels employers are seeing don't reflect the long term equilibrium price of labor.  Labor costs are interwoven with all the other inputs of production, so that this temporary disequilibrium not only prevents able workers from quickly reintegrating into the productive economy, it distorts and seizes up decision making across the economy through the destruction of information.  This is an informational and coordination problem.

This seems like an important problem for economists to discuss, but, at least out here in the blogosphere, we've got left-wing economists who would find it difficult to accept a framing that has a possible conclusion that wages are too high, and right-wing economists who would question a framing that says the central bank is too tight.  Because of these constraints, the topic seems generally ignored.

When employers say that labor markets are tight, it seems like they are being dense or hypocritical.  But, could they simply be recognizing at some level that wages are too high relative to other inputs?  Maybe their heuristics are functionally correct to lead them to be wary of raising wages further in order to expand production.

I don't think this is a magic formula where real wages have to fall back to the long term trend line.  But, I do wonder if we might see a period where real GDP and inflation are both healthy, but wages retrench a little bit while unemployment continues to fall.  The Economist (via Scott Sumner at econlog) points out that this is the current pattern in Japan.

The downside there is probably the danger of populist policies in an election year, to solve the "problem" of wages not keeping pace with economic growth.


Homeownership

It is strange to me how difficult it is for us to imagine that, on the margin, some workers might have discretion about the duration of their unemployment.  Here is an article on the effect of homeownership on unemployment duration. (HT: EV)  They find that homeowners with mortgages have unemployment behavior more similar to non-homeowners.  The extended duration and the tendency to exit the labor force come from homeowners with high equity ownership.  Yet, oddly, they seem to stick with the explanation that homeowners are less mobile and are tied to limited labor markets.

To me, this finding obviously comes from the fact that high equity home owners have more savings, more discretion, and more flexibility about how to re-enter employment or about making work-leisure trade offs.  I don't see any mention of this obvious factor in the paper.  We all know people who have discretion in their labor force decisions.  Why do they disappear when we start thinking about the big picture?

This seems like further evidence that the longer UI is extended, the more it will go to workers with discretion, and that the levels of long term unemployed and wages have been distorted in novel ways, made worse by tight monetary policy.  In the end, if the recovery was permanently slowed and there is hysteresis in gross production and in employment, I am not sure what the adjustments will be.  Where will average wages be in a healthy economy that has moved beyond these distortions?


Update:
Here is a post from Dean Baker at CEPR (HT: EV)  He points out that the Retail and Leisure & Hospitality sectors have both shown double digit increases in job openings with stagnant or declining hiring.  This could be a signal of frictions in the low wage spectrum that we might expect to see when there is policy-based wage rigidity.  Further recovery in production and employment might coincide with a normalization of hiring in these sectors, along with a relative moderation in wage levels.  CEPR is also a good window into the sources of the subsequent populist policy responses.

Thursday, August 7, 2014

Emergency Unemployment Insurance Post Mortem

When I originally looked at the North Carolina Emergency Unemployment Insurance topic (NC terminated the program 6 months early, in June 2013), it looked like the state experienced both strong gains in employment and some decreases in labor force participation, combining for very strong declines in unemployment.

But, when I last looked at it, after data revisions that came out in February, the unusual gains in employment disappeared in the revised data.  NC still saw very large decreases in unemployment, but they now appeared to be almost entirely from a decrease in the labor force.

This suggested that, if the same trend was going to hold for the US after the end of EUI in December 2013, we would see an acceleration in the declining Unemployment Rate, but that this would come substantially from declining Labor Force Participation.  Further, I noted that, since EUI participation seems to skew older, that to the extent LFP did dip, that decline would come in the older age groups.  The decline in LFP that happened earlier in the recession skewed younger, and we should see this LFP in the younger ages recover or level out, even as EUI ended.

The July employment report seems like a good place to review the data and see what has actually come to pass.

Here are the national labor force participation and employment-population ratio from 2011.  These results look similar to the original pre-revision North Carolina data.  There has been a strong rebound in EPR since the end of 2013, and LFP has dipped slightly from trend.  The dip in October 2013 was related to the government shut down, so it is a little difficult to identify the causes, but LFP has fallen below trend at a point in the cycle where we would expect it to start recovering cyclically.  (Note, I just placed the trend lines in the graph manually, with the LFP decline approximating the demographic decline I have found in other analysis.)

Here, I break out LFP and EPR by age group.  I use weighted moving averages to clean up the noise a little bit.  Here, we can see that, within the age groups, generally, LFP had turned down for most of 2013, and has flattened out in 2014.  EPR had flattened out in 2013 after recovering in 2012.  This is odd, since GDP improved in 2013, compared to 2012.  But, across age groups, there has been a distinct shift upward in both LFP and EPR in 2014.  In a previous post, I noted the unusual rise in unemployment rates for workers above 45 years old during the EUI program.  There was a skew to older workers in EUI, and I think here we can see a slightly sharper change in the 45-54 age group in LFP and EPR.  But, whatever is affecting labor markets, whether EUI or the myriad other factors, the bulk of the effect is across age groups.

I don't think we can attribute the drop in LFP in 2013 to the impending end of EUI because there was not an unusual decline in EUI beneficiaries in the months leading up to the termination of the program.  So, this data gives an even more positive picture of employment trends coincident with the end of EUI than the original data did at the end of the program in North Carolina.  And, given that this data comes out of the Current Population Survey, it won't be revised.

On another topic, which I hope to visit soon in another post, this should tell us something about potential unemployment numbers moving forward.  There is a lot of sandbagging on unemployment forecasts because of the expectation that workers will be moving back into the labor force, so that even though employment might increase, the unemployment rate will moderate.  But, as we can see here, a strengthening trend in LFP has already been happening while the rate of decline in the unemployment rate has been accelerating.

In past cycles, there have been times where an increase in LFP coincided with a flattening in the trend of the unemployment rate.  But, this has tended to happen at full employment levels.  With slack in the labor market, I expect to see a continued comovement in these measures.  There are complementarities within the economy that, in a context that isn't constrained by capacity in the labor market, could mean that increasing LFP is actually partly responsible for the accelerating decline in the unemployment rate.  If this is the case, there could be some significant positive surprises ahead in both employment and GDP.

Thursday, July 31, 2014

July 2014 Employment Preview

I don't have a lot of detail to post about this month's employment report.  As I've mentioned, the insured unemployment rate has continued to decline along with initial unemployment claims.  The oldest post-EUI unemployment cohorts are now past 26 weeks, so the improvements in insured unemployment should have a positive effect over and above any continued improvements in unemployment coming from the end of EUI and the continuing slow decline of very long term unemployed workers.

Here is a simple model of unemployment, based on the long term linear relationship between the unemployment rate and the insured unemployment rate, with a trend built in for very long term unemployed.  This suggests an unemployment rate of about 5.9%, with an expected range of about 5.7-6.1%.  Consensus is being reported at 6.1%.  I think this could be another month with a surprise gap down.

The final data point is projected.  Remaining points are historical. 
Here is the other graph I have been posting with total unemployment and insured unemployment.  There have been some recent stories that suggest the former EUI recipients have been coming back into the labor force in a healthy way.  As I've mentioned, much of the long duration unemployed had timed out of EUI and the behavior of those still on EUI had become much more normal than it had been early in the program, since labor markets in general are more normal.  So this is only half the story of long duration unemployment.  But, it is good to see the pattern start to be confirmed.  I think another part of the story that probably caused the EUI debate to lose steam is the trend that I have seen where the short duration unemployed started exiting unemployment faster after the end of EUI, so states have probably been seeing many fewer unemployed workers becoming newly eligible for an EUI program.

EUI was passed, almost unanimously, and signed by President Bush, in June 2008.  It was by far the most aggressive and generous EUI program in US history.  It baffles me that in July 2014, after having been passed with broad bi-partisan votes, it is being used as a political cudgel when the portion of the unemployment rolls that it would apply to is completely recovered.  Even as far back as December, very short term unemployment hit an all time record low.    I trust The People's Romance will soldier on.

Tuesday, July 22, 2014

Unemployment and JOLTS, with demographic adjustments

I've done quite a few posts on the significant distortions that the baby boomer lifecycle is causing in comparative labor statistics.  There are so many places where we are using time series to assess the state of the economy, and we are using measures that have stable names but that are measuring something whose fundamental character is changing.  In broad terms, for instance, we think we are measuring "Quits" or "Unemployment Rate", a stable set of data regarding an economy over time.  But, really, we are kind of measuring "Quits or Unemployment among a lot of 50 year olds" today compared to "Quits or Unemployment among a lot of 35 year olds" 15 years ago.  We think we are comparing changes in our economy, ceteris paribus, but in some cases, we are being fooled.  The economy is the "ceteris paribus" and we are just measuring how 50 year olds are different than 35 year olds.

Last December, I tried to adjust the Quits rate from the JOLTS survey to account for age demographics.  I haven't revisited the adjustments since then.  Today I thought I'd update this and see where things stand.  The red line in this graph is where we would expect Quits to be if demographics had remained constant.  The trend lines in this graph are parallel.  Growth in Quits has more or less followed the trend from 2003 to 2006, except for the period from the summer of 2011 to the fall of 2012, where it leveled out.  (It might be worth noting that this period of stagnant Quits roughly falls in the time period between QE2 and QE3, with Quits increasing on trend during the QEs.)


Here is a graph of all of the JOLTS indicators, with this demographically adjusted Quits level added.  Note that, with this adjustment, Quits is back to the same level of early 2004, when the Unemployment Rate was at 5.7%.

Job Openings is back to the level of late 2005, when the Unemployment Rate was 5.1%.  Some combination of labor market frictions is probably responsible for the lower Quits rate among older workers.  They tend to have much lower employment churn and longer unemployment durations.  Some of this is probably due to greater specialization as a result of their more mature career development, etc.  These factors would tend to cause Job Openings to be overstated, relative to earlier periods, because employers would require more time to match jobs with workers, given these frictions.  I have a fairly direct way of adjusting the Quits rate by using unemployment and unemployment duration data, by age.  These inputs aren't available for Job Openings adjustments.  If we assume that the scale of the effect is similar between Quits and Job Openings, then adjusted job openings would imply an expected Unemployment Rate of about 5.7%.

The lower churn among older workers could also explain some of the lower hiring levels, so that hiring adjusted in a similar way to quits should also imply an unemployment rate in the high 5's.

Older workers also have lower unemployment, generally.  Adjusting for age, we might expect that the current unemployment rate would be about 0.4% higher than it is if demographics were still equal to what they were in 2000.

Comparing all of these measures to the previous recession, with these rough demographic adjustments, we have:
Stated Adjusted
Quits Rate
1.6% 1.8%
Job Openings Rate
2.7% 2.3%
Unemployment Rate
6.1% 6.5%
UER implied from Quits
6.4% 5.7%
UER implied from Job Openings
5.1% 5.7%

So, the measures, demographically adjusted to compare to the previous recession, give us a picture where Openings and Quits suggest that Unemployment should be nearly 1% lower than it is.  I have separately estimated that about 1.2% of the labor force remain drawn into unemployment because of the unprecedented generosity of Emergency Unemployment Insurance (EUI).  It seems like this group of workers could explain the disconnect between unemployment and the JOLTS data.

About 0.3% of the unemployed labor force is related to lower exit rates of cohorts who became unemployed in 2013 and were generally eligible for EUI.  These workers appear to be actively engaged in the labor market, even though their unemployment exit rates were a little slow.

Another approx. 0.8% of the labor force have very long unemployment durations and would have been expired out of EUI even if it hadn't been terminated at the end of 2013.  The Quits and Openings rates may suggest that these workers have a limited impact on quitting and hiring decisions of other workers and employers.

I have done a lot of posts on Labor Force Participation Rates where I have argued that LFP, once adjusted for demographics, is roughly where we would expect it to be at the end of a deep recession.  But, that LFP level includes these Very Long Duration Unemployed workers in the labor force.  So, these are not workers who would have left the labor force without EUI.  They are probably mostly workers who would have reentered the labor force.

I've been fairly clear that I don't think such long term EUI was a wise policy.  I'm not sure we did these workers any favors by having such generous EUI policy.  If the main point of this policy was to lessen the incentive for them to accept sub-optimal work opportunities in the months following their loss of work, it seems that what we have done is to create about a million and a half workers, who, at the end of the labor contraction, still are in a position where they will need to accept sub-optimal work opportunities, but now have to try to acquire those opportunities with a big red flag on their resumes.  So, they are likely, after having missed two years or more of potential productive work time, to be facing even worse opportunities than they had initially.  In trying to save workers from uncomfortable, but manageable, outcomes, we may have subtly pushed them into desperate outcomes with no obvious, systematic solution.

In any event, these workers are slowly leaving unemployment, though it is unclear where their marginal flow is going - to work or out of the labor force.  The net result may be that we have a labor market that, for the most part, is operating at full employment.  Normally, there would be some segment of opportunistic labor that would cause cyclical fluctuations in labor force participation.  Now there is an additional segment that will also reenter employment cyclically, which might be another reason to expect an exceptionally long recovery period, if we can avoid having all the "bubblemania" jibber-jabber push the Fed into unnecessarily hawkish monetary policy.

The best scenario probably involves short term interest rates hitting 2-3% pretty quickly after their initial lift, and then moving sideways, a la the late 1990's.  My fear, which is probably becoming a broken record, is that this scenario probably includes an equilibrium price of homes 30-40% higher than today's, adjusted for inflation over time, and I don't think the Fed and most everyone else wants to believe me (or the market) over their own lying eyes.

Friday, July 18, 2014

June Unemployment Review

With the June employment report, we are now 26 weeks past the end of EUI.  As I mentioned last month, the faster exit rates of the cohorts of workers newly unemployed since the normalization of unemployment insurance have now worked their way through all of the shorter duration categories, so that the remaining decline in unemployment will come from the ">26 weeks" category - both from the continuing extension of the more normally behaving unemployment cohorts into the longer durations and from the continued slow decline in the number of very long duration unemployed workers who had timed out of EUI.

This evolution is apparent in this month's numbers.  Here is a graph of the numbers of unemployed, by duration.  The arrival of the post-EUI cohorts in the ">26 weeks" category has accelerated the decline in this category in the last couple of months while the declines of the lower duration categories started accelerating last fall and have now leveled off.

My measure of the percentage of long term unemployed workers (15 weeks +) who exit unemployment over the following three months also continued to improve in June, jumping to 43%.  This measure has persistant cyclical behavior, and if this levels off at 45% between now and December, this should correspond to a drop of 0.4% in the ">26 week" category by December.  So, this indicator also points to a mid-5% range rate by year end, simply from inertia in employment trends.

Here is a graph of actual ">26 weeks" unemployment (blue) and the predicted level of long term unemployment, modeled as a linear combination of lagged short term unemployment durations.  We can see here the continued expected decline of long term unemployment to healthy levels (as cohorts with faster exit rates extend through the longer durations) as well as the convergence of actual long term unemployment to the expected level (as very long term unemployed workers continue to exit unemployment).

In the next graph, we can see how the unemployment rate has been inflated compared to the regular insured unemployment rate.  Since most of the reduction in unemployment has come from faster exits from workers unemployed after the end of EUI, the improvement in unemployment has mostly been in proportion to reductions to regular continued unemployment claims, in 2014.  The current level of continued claims would normally correspond to an unemployment rate of less than 5%.  About 0.8-0.9% of the difference, by my estimates, is due to very long term unemployed (average durations around 2 years) and about 0.2-0.3% of the difference is due to the remaining more typical excess unemployed workers.  We should see continued claims start to level out, and if the unemployment rate does fall to 5.5% by December, any remaining improvements in unemployment will probably be due to residual improvements in normal recovery unemployment behavior and the continued exit of 0.5% or so of remaining very long term unemployed, if they continue to exit at their established rate.  (Although, there appears to be unusual continued strength in the normal employment market, as continued claims continued to fall with this week's report.)

Monday, June 9, 2014

May 2014 Employment Review

I had wondered if this month would confirm a strong employment trend, which would have corresponded to a range of 5.9%-6.3%.  Or, this month could suggest that trends are continuing along the long term pace and last month was a statistical aberration, which would have corresponded to a range of 6.1%-6.5%.  The month came in at 6.3%, and it looks like a combination of the two.  There was some statistical reversion compared to last month, but with some hopeful signals.

The first graphs here are from flows data.  These are pretty noisy numbers, so it is tough to see much change from month to month.  All of these flows reverted back from last month's strong movements, which was expected.  The trends are all moving in the right direction, but last month's improved unemployment numbers were partly from unusual movements.

The next graph is the comparison of insured unemployment and total unemployment.  There was some snap-back this month.  This will bounce around from month to month, as all of these indicators do, but last month's drop in unemployment was much closer to the trend in this relationship than this month's pause.  This points to more potential for falling unemployment in the coming months.

The remaining graphs are related to unemployment by duration of unemployment.  This data shows strong confirmation of less persistent unemployment coinciding with the end of EUI.  First, regarding this month's unemployment, the total number of unemployed workers remained about the same as last month.  But, note that this comes from an increase in very short term unemployment and a decrease in long term unemployment.

Both initial and continued claims on unemployment insurance have been declining recently, so this increase in short term unemployment is probably either (1) the result of a surge in quits (which we won't be able to confirm until JOLTS data for May is released in July), or (2) the result of a statistical aberration in the May numbers, overstating unemployment.  Both of these would be reasons for bullishness on employment.

This improvement in unemployment churn is evident in the % of long term unemployed exiting unemployment, which surged this month to more than 38%.

The next graph is the unemployment by duration graph, again, but in line graph form.  This helps to see the shape of unemployment over time, and the change in unemployment durations as we have left EUI.  I was originally wrong about exactly how this would play out, because I didn't fully account for the fact that many of the very long term unemployed have timed out of even EUI.  So, there is a group of very long term unemployed that is slowly shrinking, by about 0.05% of the labor force per month.  They are not effected by EUI.  By the end of 2013, for unemployment durations under about 75 weeks, the labor market was fairly normalized, but EUI and the existence of marginally attached workers and very long term unemployed workers were continuing to push unemployment durations higher.  The end of EUI increased the exit rate from unemployment for workers across durations.  This is visible in this line graph.  The decline in very long term unemployment has continued to decline at a stable pace.  But the big change in the past 8 months has been the additional decline in 5-26 week unemployment (which also pulled down the "over 26" category at a stronger pace).

This has probably mostly played out at the lower durations.  As these cohorts age, the longer duration categories will inherit smaller cohorts because of these higher exit rates, so that, over time, long duration unemployment will decrease as a result of employment trends that are already established today.  Generally, long duration unemployment in the near future can be roughly estimated by the relative behavior of the shorter durations.  Next is a graph comparing actual long term unemployment to the unemployment predicted by shorter durations.  Here we can see how there was unusual employment behavior specific to "over 26 week" durations.

The next graph shows the difference between the forecasted long term duration unemployment and the actual long term unemployment.  I consider this to be a rough approximation of the number of very long unemployed workers.

May's continuation of these trends continues to suggest that, excluding the very long term unemployed, the unemployment rate is down to about 5.3%.  A 5.5%-5.7% unemployment rate by the end of 2014 still seems reasonable.  Compared to today's 6.3% rate, in broad terms, it looks to me like about 0.1% will come out of 15-26 week durations, about 0.2%-0.4% will come from the natural continuing decline in "over 26 weeks" as the higher exit rates of recent cohorts continue to move through the durations over time, and about 0.3% will come from the continued decline in very long term unemployed (shown in the last graph).


Tuesday, June 3, 2014

May 2014 Employment

It's hard to know what kind of movement we will see in the unemployment rate this month, after such a sharp decline last month from 6.7% down to 6.3%.  Unemployment insurance claims continue to signal optimism.  Here are the weekly figures in initial and continued claims:

The second graph is my comparison of continued claims to the unemployment rate.  As with last month, there are two trends working in the favor of good news.  One is that continued claims have been declining dramatically, which should coincide over time with a general decline in unemployment.  The other trend is the convergence we should expect to see between the actual unemployment rate and the unemployment rate we have historically seen relative to the insured unemployment rate.

Of course, there is a lot of noise, month to month, with all of these indicators, but the trends look positive.  I believe that the divergence from historical unemployment levels was related to the generous level of Emergency Unemployment Insurance (EUI), which ended at the end of 2013.

The new level of continued claims would correspond to an unemployment rate of 6.1% without any additional convergence to the historical unemployment level. (edit: this estimated May level is the last point on the blue series in the graph.)  If the end of EUI is creating a new trend with a more steeply declining unemployment rate, then this month could see another gap down, with an expected range of, say, 5.9% to 6.3%.  The decline in continued claims may be a result of generally faster unemployment exit rates across unemployment durations, related to the end of EUI.  If that is the case, then we should expect there to be a convergence to historical trends along with the decline in UI, since there should also be an increase in unemployment exit rates for unemployment of durations slightly over 26 weeks, in addition to the decline in unemployed workers who are still eligible for regular UI.  So far, however, there appears to be a population of very long term unemployed whose exit rates remain very slow and, lacking a change in their own trend of employment behavior, will slow some of the convergence to historical levels until well into 2015.

If I am wrong about this new trend, and last month was mostly a noise event, we might be looking at an expected range of more like 6.1% to 6.5% in May.

Friday, May 2, 2014

April Employment and EUI

Previously I had modeled long term unemployment by comparing long term unemployment durations to short term unemployment durations.  Here I have modeled long term unemployment rates as a linear combination of the shorter duration unemployment rates, to compare the results to the other model.  The results turn out to be similar.

Here is the 66 year history of the model.  The specification is based on the relationship from 1948 to 1991.  The deviations of the model in 1992 and 2002 coincide with the previous two recessions and the previous two EUI episodes, which were much less generous than the recent episode.

Next is the difference between the modeled Long Term Unemployment Rate (over 26 weeks) and the actual LT Unemployment Rate.  This is similar to the numbers I have arrived at through other methods.  And, I believe the story is similar for the current labor market.  The very long term unemployed seem to have a linear behavior that is not related to EUI policy at this point, because this group had probably mostly already timed out of the program.  As with my previous estimates, this estimate suggests that this group is shrinking by about 0.05% of the labor force each month.  So, if this continues, the unemployment rate should continue to decline by about 0.6% over the next year.

I think that this method does help show how the end of EUI has filtered through to recent declines in the unemployment rate.  Beginning in the fall of 2013, unemployment durations of 5 to 26 weeks acquired a new, sharply declining trend, which has continued through April.

Durations from 15 to 26 weeks might continue to decline by about 300,000 (about 0.2%) over the next few months, but that would bring it near to probable trough levels.  These recent declines in short term unemployment should filter through to long term (>26 week) unemployment, with 0.1 - 0.2% in future declines already in motion and another 0.2 - 0.3% decline possible if the 15-26 week category continues to decline.

I think this realistically adds up to declines by the end of 2014 of about a 0.4% UE decrease from the VLT group and another 0.4% UE decrease from the trends that began in late 2013 in shorter duration categories and the expected declines those trends should produce in the long term category.  That puts us at 5.5% unemployment by the end of 2014.

It is possible that these trends will dissipate, but there is no evidence of that happening now.  And there might be some snap-back from the April number, but I don't see any reason to expect anything above, say 6.4%, even figuring on some noise over the next couple of months as the downtrend continues.

Labor Force Participation

The Employment to Population Ratio has shown some slight momentum over the past couple of years, but labor force participation continues to show weakness.  This doesn't quite fit with my amended theory of the EUI.  I would have expected some weakness coming out of EUI as some relatively small proportion of long-term unemployed would have exited EUI by exiting the labor force.  However, if there is this bifurcation among long term unemployed, and if the end of EUI didn't really affected the behavior of the very long term unemployed, I wouldn't have expected there to have been much LFP weakness.  If the end of EUI mostly caused an exit from unemployment among unemployment durations of, say, 5 to 40 weeks, I would have expected a smaller portion of those beneficiaries to have left the labor force.  But, there does seem to be some weakness in LFP coincident with the end of EUI.

We might continue to see more of this weakness over the next few months before LFP finally settles back into a direction parallel to (or reverting to) the demographically adjusted trend.

April 2014 Employment Review

The noise went back the other direction this month & took us all the way to 6.3%.  Let's take a look at the parts & pieces.

First is unemployment by duration.  I suspect there was some statistical noise this month that moved unemployment down.  Here we can see that unemployment declined across durations.  But, all the excess unemployment is currently in the ">26 weeks" category.  The other categories are pretty much at normal levels.  They might have a few 100,000 to give between now and the cyclical peak, almost entirely from the 15-26 week category.  (As a percentage of the labor force, that dip in 0-4 week unemployment in December was the lowest level ever recorded.)  So, while it's a good sign to see them declining, there is likely to be some bounce-back there in the coming months.  Also, keep this is mind when reading the inevitable misreadings of statistical noise as desperate workers giving up.  That story doesn't match up well with the significant declines in short-duration unemployment.

That statistical noise looks like it helped the ">26 week" category, too.  I am not seeing any unusual decline in my estimated number of very long term unemployed this month, so I don't believe that this month's decline is strong evidence of an EUI effect, although the trends remain relatively positive, in general.  Most of the decline in unemployment over the past few months has been among workers under 45 years old.  There appears to be a correlation between older workers, EUI, and very long term unemployment, so the relatively small decline in unemployment among older workers also suggests that the unemployment decline is not particularly related to the termination of EUI.

I have been watching the churn in long term unemployment.  The gross number of people leaving long term unemployment over the past 3 months has been remaining strong at about 2 million.  It dipped down to about 1.8 million last month.  It recovered to about 1.9 million this month, so it didn't get all the way back to 2 million, but at least it's heading in the right direction.  January wasn't an easy month to compare against, either.  If this flow remains at 2 million a quarter, long term unemployment should be below 3 million by July.

It's a similar story if we look at this flow as a percentage.  It bounced back this month to above 35%, and the moving average continues to improve, but I would have liked to have seen a stronger shift in the trend coming out of the end of EUI.  As I mentioned yesterday, though, the problematic portion of very long term duration unemployment probably did not have much of a direct involvement with EUI by the end of 2013.  The re-engagement of that group of workers with the labor force will probably be a little more complicated and slow than we would like.  I still expect to see an acceleration in the exits from long term unemployment, but this is a process that will continue for many months.  Here's a graph of the duration categories back to 2006, for reference.  Keep in mind that population growth and demographic shifts probably will keep the longer duration unemployment levels from declining all the way back down to 2006 levels.

In the comparison between continued unemployment claims and the unemployment rate, this month obviously pulled us back toward the long term relationship.  But, as we can see in the graph, there is a long way to go, and this month's movement, in terms of this relationship, was not unusual.  The question will be how quickly this convergence happens.  It's hard to see that in this graph.

Here's a graph of the ratio over time.  This shows a few interesting things.  First, we can see how when a recession first affects the labor market, the ratio decreases, because an uptick in involuntary unemployment creates a sharp increase in unemployment claims.  The ratio then increases as sclerosis in the labor market leads to longer unemployment durations, so that the unemployment rate includes many workers who are not collecting standard UI benefits.  Then, the ratio declines back to typical levels under 3.0 as the labor market recovers.  Second, it is interesting to see that in this cycle, EUI was implemented before there was the typical cyclical increase in standard unemployment insurance claims.  Third, it would be unusual to see a decline to the level that would correspond to full recovery in less than about 18 months, at the soonest.  But, the current relationship is highly unusual, so it wouldn't be out of the question to see the return to a normal ratio level happen more quickly than it has in the past.

It really is pitiful, the extent to which the federal government damaged the labor market in 2008.  In June, they instituted EUI, which would have the effect of making the labor market less flexible because it would have some marginal influence on sticky wages.  Then, in July, they instituted the second in a string of minimum wage hikes.  So, in a context where Congress is clearly concerned about labor market health, they force a wage hike on the most vulnerable workers.  Talk about sticky wages.  Then, at the Fed meeting in September - a meeting where FOMC members explicitly state that they believe that EUI has already had a negative effect on the unemployment rate, the committee decides to inflict the labor market that has been freshly seasoned with significant wage inflexibility with a whopping deflationary shock.

Flows

Looking at flows, we can see some of the likely statistical favors this month's employment report received.  In every single pair of flows, this month's movement was favorable.  These tend to be very noisy, so this was likely a one-time improvement.  But, it is important to keep in mind that all these flow pairs are going in the right direction, and the previous 3 months have had noise-movements in the other direction, so that it is likely that 6.3% is a legitimate reading and the unusual movement was the result of the movements in the other direction in previous months.

Even with the drop in "NtoE", the cumulative flow from NtoE over the past 4 months is still very high.  The flows between U and E (green and blue) have been showing tremendous strength, and this month's positive movement is part of a well established and positive trend.  The decrease from "NtoU" follows several months of unusually positive readings compared to the longer decreasing trend.  And, this is counterintuitive, but a decrease in this flow is bullish.  We tend to see this through a narrative of desperate workers coming into the labor force.  But, it is just as likely that a decrease is the result of a lack of desire for work among those who are not in the labor force.  The fact that this pair of flows has a clear pattern of being low during booms and increasing during busts strongly suggests that something like the positive interpretation is dominant.  This set of flows is the one set that has been unusually high relative to other measures of the labor market - probably due in part to EUI - so a decline in this flow pair is something we should expect after the end of EUI.  The complicated relationship between EUI and very long term unemployment is evidenced by the high level of this flow pair compared to historical levels.  I'm disappointed that we haven't seen more decline in this flow pair since the end of the year.

Lastly, looking at the flows into and out of unemployment, we can see a little bit each of legitimate strength and statistical noise.  The extreme decline in unemployment owes partly to the unusual decline in the net "NtoU" movement.  But, we can see that this net flow has been unusually high since December.  The trend in this net flow has been flat since the beginning of 2011, and the cumulative net flow of the last few months is roughly in line with that trend.  Net flows from Unemployment to Employment have been trending up nicely since the beginning of 2011, which is a sign that the labor market is actually gaining momentum.  This month had a strong net flow here this month, but it wasn't highly divergent from trend.

I think the totality of these indicators suggests that 6.3% as of April 2014 is a good estimate of long term trends in the labor market.  Labor markets look relatively strong even though there is no clear indication yet of an EUI-related 2014 boost.