But, if you can draw a boundary around the potential volatility you can expect to handle, you can make sure your leverage is low enough to prevent a meltdown.

This graph represents the potential payouts of this kind of strategy. It books profits over time, but as the price moves away from the midpoint, the losses can become catastrophic quickly.
We have an unusual situation in forward interest rate markets, where short term rates are certain not to budge, and at some point around the end of 2014, we can expect short term rates to follow a path, managed by the Fed, up to some higher level. The first rate increase is very likely to come between September 2014 and March 2015. In the meantime, there is a lot of volatility in the middle part of the yield curve, around 2016-2018. So, the question is, if we want to earn profits by mitigating that volatility, where would we set our boundaries?
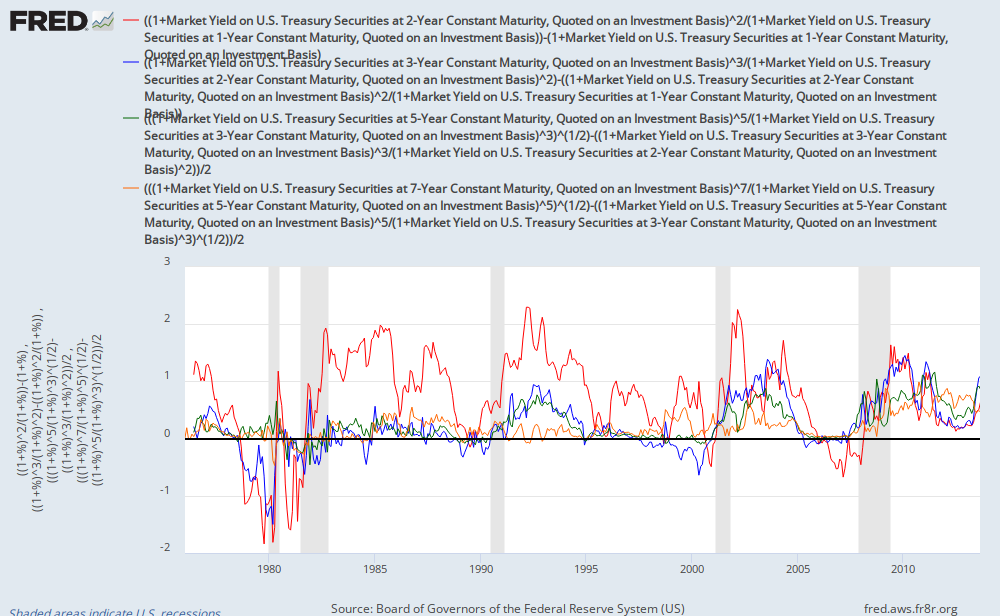
This is a graph roughly measuring the slope of the yield curve along several segments, over time. There appears to be a typical slope in the short end of the yield curve that reaches about 2%/year at the point in time where the Fed is expected to raise Fed Funds rate for the first time. In other words, if the 1 year interest rate is 3% when the Fed starts to raise rates, forward markets will price the rates one year ahead at about 5%, 2% above the beginning rate. The yield curve levels off to a slope of 1%/year or less after that.
This should put a cap of about 4% on contracts that are about 3 years out from the initial interest rate increase. So, while short term rates are near zero, the bullish boundary would put September 2017 contracts at about 4.25%. I estimate that a bearish scenario of a rise in March 2015, with a slower rate of expected Fed Funds increases would give an expected value for the September 2017 contracts of about 2.75%.
Daily volatility is fairly high, as investors second guess Fed stances and daily economic indicators. But, I expect there to be a very strong mean reversion behavior within these boundaries, until the rate increases commence. As the date of the rate increase approaches, the planned range of the strategy can be occasionally adjusted to reflect new information on the health of the economy, if necessary, although this can create some costs, depending on where prices are at the time of the adjustment.
The low rate environment limits the ability of the expanded money supply to goose investment and spending, so I expect the eventual path of short term rates to be slower than 2% per year. But, by the time the actual spot rates start moving, it will probably be time to put this strategy away for a while.
No comments:
Post a Comment