
So, I think a big question for forecasting the January labor report is, what caused that dip in short duration unemployment? To give an indication of how extreme this was, below is a historical graph of 0-4 week unemployment duration:
 Seasonally adjusted short duration unemployment hasn't been this low since 1974 - and this is raw numbers. December 2013 had the lowest 0-4 week duration unemployment rate ever measured. I would blame the seasonal adjustments, and maybe the timing of Thanksgiving or something, but November's figure was pretty low, too, and the 5-14 week unemployment levels don't show any unusual movements. Even in the non-seasonally adjusted numbers, the combined November/December level of 0-4 week unemployment is lower than it's been since the 1970's.
So, the BLS data doesn't expose this as an obvious anomaly. But, I would still say to be prepared for a rebound of 0.2% or so in the January unemployment rate after factoring in other issues, because there is a good chance that this was not a sustainable reduction.
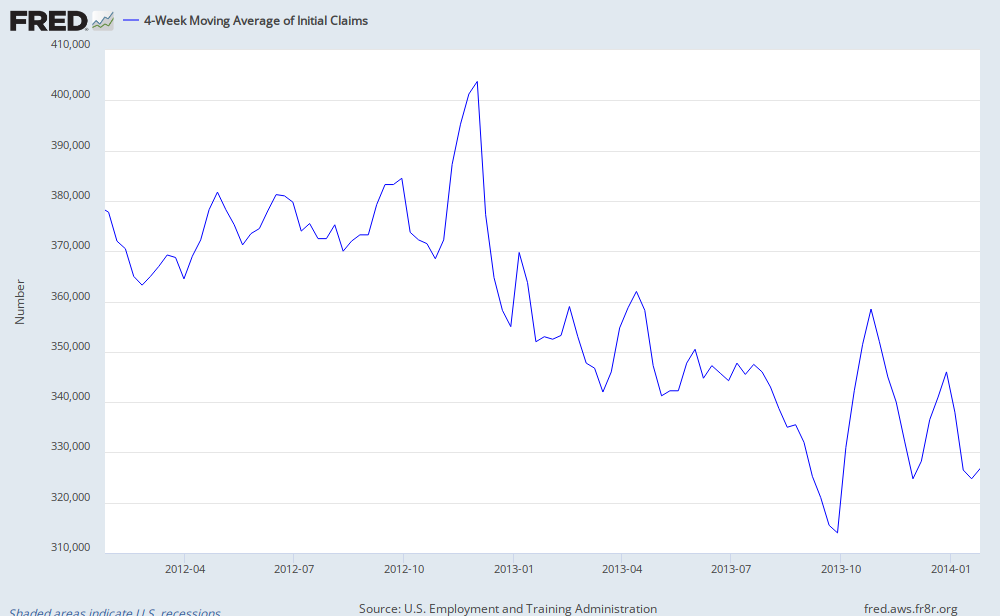
One reason the short duration unemployment might be low is because layoffs in the JOLTS data have been very low. But, initial claims the last few months have not been unusually low, although they have been unreliable lately:
 And, this is not the sign of a recovering labor market. Recoveries usually see an increase in labor churn, so that low-duration unemployment doesn't change much, but unemployed workers are able to find work easier, so that long duration unemployment declines.
Another place to look for clues is the employment flow data from the CPS. Here is a chart of some of the flow patterns:

The one thing that jumps out from the last two months is a very low flow from Employed to Unemployed that is accompanied by continued strength in the flow from Unemployed to Employed. There has been a flattening out of the downtrend in Unemployed to Not in Labor Force flows, but this appears to be balanced out by a similar flattening of the uptrend in Employed to Not in Labor Force. This leaves the flow from Not in Labor Force to Unemployed, which appears to be following a normal trend, and Not in Labor Force to Employed, which has taken an anomalous turn down for nearly a year.
So, the two flows which appear to be causing the unusual decrease in the unemployment rate are (1) a very low level of layoffs and discharges (which aren't strongly corroborated by unemployment claims data) and (2) an unusually low flow of workers from Not in Labor Force directly back into Employment.
I would expect a small outflow from unemployed to not in labor force due to the end of emergency unemployment insurance (EUI), and this movement more generally is what usually is blamed for the declining labor force participation rate. On the one hand, this data shows a more complicated picture of the labor market than a story of discouraged workers. On the other hand, these recent trend anomalies don't replace that narrative with any coherent narrative that I can see. A continued downtrend in the flows between employment and Not in Labor Force might be an early sign of an economic downturn. It will be interesting to see how these numbers evolve.
I expect to see strength in the Unemployed to Employed flow, due to the end of EUI, although some of that might flow through Not in Labor Force before the dust settles. If that is the case, and we see a continued gap between the blue & green lines above, that is where I see the potential for a strong labor market for the first half of the year.
Speaking of EUI, leading up to when North Carolina halted EUI in June, they seemed to experience a similarly odd decline that, on net, was a flow from Employment to Not in Labor Force. I don't know the mechanism at work, but we now appear to have two periods leading up to termination of EUI where we have seen this flow in the data. Let's hope that on the national level we see a transfer out of unemployment into employment like we have seen in North Carolina since June.
And, speaking of North Carolina, I was surprised to see how sharply initial unemployment insurance claims have dropped there. In addition to halting EUI, they also limited regular UI, including limiting it to, I think, 19 weeks (normally it's 26 weeks). But, the size of the drop in initial claims still surprises me. (North Carolina in red, National in green, not seasonally adjusted.):

No comments:
Post a Comment