Wednesday, March 2, 2016

Housing: Part 122 - Housing Starts + Manufactured Homes

My blogging might be a little spotty for a while, because I am working on the book.

Here are some charts of housing starts, which include manufactured housing, which I think brings up an interesting point about perceptions during the housing boom.

The first graph is of homes built for sale and homes built by owner.  Note that there was a sharp uptick in homes built for sale, but homes built by owner had actually fallen.

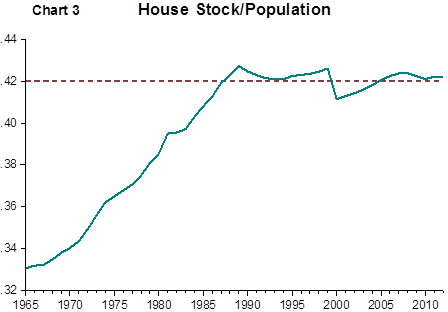
The next graph has the total level of 1 unit housing starts, plus multi-unit starts, plus manufactured home shipments, and the total starts and shipments of all types.  They each include a dotted line of the average level over the period of the data in the chart.  I haven't taken the time to do it here, but if we just use the average for 1963 to 2005, before the bust, total starts and shipments was barely even above the average.  We can see here that, even without adjusting for population, housing starts + shipments at the peak in 2005 were normal for an expansionary period.

That is why the housing stock, relative to the population was flat.  (It was actually declining relative to the population over 16 years of age.) There wasn't even a housing boom.  We all just decided to freak out about the one type of homebuilding that was growing - single family units for sale - and ignore every single other category of housing supply, which included homes built by owner, multi-unit homes, and manufactured homes.  All of those categories had been in decline.  Of course, it was the decline that created the illusion of a boom, because it was precisely those cities where we can't build, yet where income opportunities are available, where home prices were skyrocketing, because households were bidding up the stagnant pool of homes in those cities in an attempt at economic opportunity in a country that has become inflexible.

In an economy that has arbitrary limitations on supply, especially political limitations, the least powerful citizens get pushed aside.  They have been getting pushed aside - pushed from New York and Boston and California to Atlanta and Dallas and Phoenix and Riverside.  Now they can't even be pushed, because we decided only the wealthiest can get mortgages.  We need to protect the others.  So now they are nice and safe between a rock and a hard place.  It is true.  If we prevent them from ever owning anything, we will be preventing them from ever having a default or a foreclosure.  That's how much we care.

You know all these discussions serious people have been having for a decade about the housing bubble and the oversupply that inevitably had to pop?  We didn't even have it.  Didn't exist.  Never happened.  We might as well be arguing about what caused the sudden rise of civility in American politics.

Here is a map of shipments by state.  Guess which states tend to accept a lot of shipments of manufactured homes, which are an inexpensive way for low income households to become homeowners.

Monday, February 29, 2016

Economic Forbearance in America

Here is a post from Brookings on occupational licensing (HT: Arnold Kling) with a striking graph from the White House report on Occupational Licensing (pdf):

As strident as I have become on the housing issue, I could believe that occupational licensing causes more economic stress than housing constraints.  The second graph shows the growth in licensing requirements over time.

I think this issue actually intersects quite a bit with the housing issue.  If you are cutting hair in San Jose, and the rent just got raised to 60% of your income, you've got to make a change.  But, the problem is, your credentials only have value locally.  The barber's license gave you some competitive advantage in California, but it's probably useless if you move to Iowa.

So, now, not only have you been pushed out of your home and your community, but the state has incentivized you into an occupation such that this dislocation will be especially painful.

Also, remember that fluctuations in homeownership have been highest among the younger age groups.  They are also entering an economy that is more defined by credentialism, and their migration patterns, shown above, are affected most strongly.  We really have been taking it to young adults.

I wonder if this is a partial explanation of the migration patterns we saw in the 2000s.  State licenses will apply in Riverside.  So, it might be worth spending 40% of your income on rent in Riverside, even if it means a 20% cut in income.  And, there is some regional reciprocity in licenses, so maybe this means the move to Las Vegas or Phoenix is also valuable, even if the housing contagion is spreading to those cities.  Those states would be much more valuable locations than a state where your license is worthless.

This affects countless sectors - health care, construction, education, personal services.  And, the problem is more acute with two wage-earners.

There is a lot of discussion about the problem in Europe of having a monetary union where there are cultural limits to labor migration and significant differences in local governance and standards of living.  I'm afraid we are moving in that direction without taking notice.  These issues are largely local in nature.  Pragmatically, this adds up to meaningful limits on interstate trade, but it has happened in a piecemeal sort of way.  Death by a thousand cuts.

Thursday, February 25, 2016

Corporations should pay their fair share.

Corporations should pay their fair share.  This is a refrain often heard on the campaign trail.  Believe it or not, the US has the highest corporate tax rate (35% + state taxes, estimated to total about 39%) in the world. Here is a list of corporate tax rates, by country.  In addition to the high rate, the US is one of a few (and shrinking) number of countries who tax foreign income.  Most countries only tax corporate revenue that is earned within their borders.  Even this wouldn't be that big of a deal if the US didn't have extraordinarily high tax rates.  If the US taxed worldwide revenue at a reasonable rate, similar to other countries, then corporations wouldn't have to pay that much after deducting the taxes they have already paid to the foreign countries where the income was earned.

Before we get into the numbers, I just want to consider how weird the public debate on this is.  For instance, the Obama administration has been pushing for capital controls to prevent corporations from moving out of the country to lower tax jurisdictions (which, as noted above, is roughly the entire rest of the world).  Burger King was targeted because they merged with Tim Horton's and moved their headquarters to Canada.  Moving to Canada is now considered a tax dodge.  Literally any business any US corporation conducts abroad can be derided as a tax dodge, because there is nowhere else a corporation could conduct business under a more onerous tax regime.

The usual response to this is that the real rate is much lower because of all the corporate loopholes.  Think about this.  If real corporate tax rates were actually lower, then why would they be moving to Canada?  Either de facto tax rates are low, or there is an epidemic of corporations moving to other countries to avoid high taxes.  Both can't be true.

Here is the White House (pdf: corporate tax expenditures start on page 228) estimate of tax deductions.  In 2015, corporations will pay about $340 billion in taxes.  Corporate tax deductions ("tax expenditures") total about $130 billion.  Of this, about $65 billion (from the White House file) is "Deferral of Income from Controlled Foreign Corporations".  This is the net additional tax firms would pay to repatriate their earnings from foreign subsidiaries.  Note, this is only considered a tax deduction because (1) the US has the highest corporate tax rate and (2) we impose that tax on foreign earnings in a way that most of the developed world does not.  In other words, if we simply mimicked, say, Denmark (23.5% tax on domestic income), US corporations would pay lower taxes and this $65 million would not be considered a tax deduction, because Denmark would have never considered it to be taxable income in the first place.

The next four largest corporate tax deductions are: $11.4 billion on "Deduction for US Production Activities", $9 billion on municipal bond interest, $7.6 billion for low income housing credits, $6.6 billion for expensing R&D activities.  These four, together, account for about half of the remaining deductions, and I think only the $11.4 billion would contain some of what people might generally be imagining when they think about corporate tax loopholes.

As a comparison, the four big individual housing tax deductions (imputed rent, mortgage interest, capital gains, and property tax deductions) total about $218 billion.  The deduction for employer provided health insurance is about $206 billion.

There is support among economists on both the right and left to eliminate (not reduce - eliminate) the corporate income tax and to eliminate these individual deductions.  These changes would, on net, make the tax code more progressive without reducing total revenues significantly.  Some of the housing deductions are much like the supposed deduction on foreign corporate earnings.  They are only considered deductions because we presume to tax them to begin with.

The taxation of rental income from tenants, which is not imposed on homeowners, is a very large and regressive tax expenditure.  This regressive taxation would automatically go away if we stopped taxing capital income.  Some, or all, of any revenue shortfall, in aggregate terms (local, state, and federal) could be made up for with higher property taxes.  Lower income households tend to spend more on housing, so property taxes are still somewhat regressive, but they are less regressive than our current set of capital taxes, which include large tax benefits, like nontaxed imputed rent and deducted mortgage interest, that are aimed solely at high income, high wealth households.  Somewhat higher property taxes would also probably help to alleviate some of the volatility we have seen in housing markets.

Anyone having political debates where they presume that higher corporate taxes are a step toward fairness is simply not engaging with reality.  Our current tax regime compares unfavorably in this regard to every other country on the planet, and doing the exact opposite of that would actually better achieve the end result of creating a more fair tax regime.

Corporate taxes don't fall on the corporation.  After tax capital income has been a very stable proportion of total domestic income for many decades, with various levels of corporate income tax.  The distribution of incomes emerges from an infinitely complex set of inputs which are not significantly changed by a marginal change in corporate tax rates.  Corporate taxes are not particularly progressive or regressive because they don't particularly fall on shareholders.  In these two graphs we can see that total capital income (after tax corporate profit + interest income + proprietor income) is fairly stable over time, after tax profit is more stable than pre-tax profit, and most of the change in capital incomes come from changing shares of interest and proprietor income, not changing tax rates.  Capital income is such a stable portion of domestic income that its level is an insignificant factor in changing wage levels.  And, corporate tax rates have little discernable effect on the aggregate level of after tax capital income.  In short, corporate taxation would not be an important topic on a pragmatic platform for economic prosperity and fairness, and to the extent that it might be a topic, the elimination of corporate taxation would be the policy goal.

The effect of taxes on after tax profits can be seen clearly with municipal bonds, which are one of the larger corporate tax deductions.  The White House estimates this deduction at $9 billion, or a little less than 1% of domestic corporate profits.  So, the accounting for this appears to pull the effective tax rate down by a little less than 1%.  But, this tax deduction isn't a corporate tax deduction.  It is a municipal tax deduction.  Since municipal bonds are tax deductible, they pay lower interest rates, saving money for local governments and agencies.  So, if a municipal bond pays 3%, an equivalent corporate bond will typically pay something like 4%.  This is a well known issue.  So, this tax deduction reduced corporate taxes by $9 billion, but it also reduced corporate profits before tax by something close to $9 billion.  The existence of the municipal bond tax deduction has little effect on after tax corporate income.  Most taxes that are universally applied will have a similar effect.  Municipal bonds just happen to be publicly traded in liquid markets, so that we can see the effect easily.

Here is one more graph, measuring Compensation over time.  The upper and lower bands represent the maximum and minimum share of domestic income that has gone to compensation over this period.  Overwhelmingly, it is the growth rate of total domestic income that raises future Compensation levels, not the relative share, which is fairly stable over time.  And, of course, according to my recent research, both the decline in total growth of domestic income and the decline in relative compensation income to the bottom portion of its long-term range, are largely attributable to our destructive limitations on urban housing expansion.  This is why we don't see an unusual rise in capital incomes in the graphs above.  I didn't include income to homeowners in that graph, and that is the income category that has risen during our recent malaise.

We are the 100%.  Overwhelmingly, our well-being is a product of past growth rates.  Income shares between corporations and laborers are too stable to make much difference in aggregate income levels, and even if they weren't corporate taxes don't have much of an effect on after tax corporate income anyway.  The best tax regime, considering these issues, is the regime that encourages production and growth.  I will leave it as an exercise for the reader to decide if haranguing corporations as they move away to anywhere else in the world to avoid a tax that has little effect on income distribution is a sign of success.

Wednesday, February 24, 2016

Housing: Part 121 - Michigan's Odd Place in the Housing Bust

Michigan keeps strangely popping up in readings about the housing bust.  It's strange, because I don't think Michigan is the place we usually think of when we think about the housing bubble.  Mian and Sufi seem to use it as an example of how low income households were herded into unsustainable mortgages.  Low income neighborhoods in Detroit certainly paint a certain picture in our heads.

Source
They find correlations at the local level between low incomes and home price volatility.  I would expect gentrifying or improving neighborhoods to experience housing gains at the local level in any market, bubble or no.  And, I would expect neighborhoods with a large number of recent purchases to be more vulnerable to a severe price contraction.  I'm not sure how to separate these issues from signals of predatory credit.  Maybe they address this in ways I haven't seen yet.  I haven't looked at all of their research.

Share of mortgages with principal balance exceeding estimated home value: 2009:Q4
Source: San Francisco Fed
But, at the metropolitan area level, Detroit seems like a strange choice as the lead character in the housing bust drama.  Home prices in Detroit were flat during the boom - even declining in real terms.  This is because depopulation was bringing down rent inflation and expected rent inflation.  Housing was becoming more affordable in Detroit.  It is true that this is not a particularly fitting context for some types of subprime loans, according to Gary Gorton, which tend to depend on stable or rising home prices.  So, there may have been some borrowing on inadvisable terms.  But, it seems likely that the housing boom in Detroit was less about high expectations about capital gains than it was about staking an ownership claim in a neighborhood that wasn't dying.

Negative equity was high in Michigan at the bottom of the bust, which does sort of place it in a category with the places that saw sharp price spikes and contractions.  But, on an aggregate scale, Detroit does not show any signs of the boom.

Mortgage affordability was flat, much as in the Open Access cities of the sunbelt, until it fell to extremely low (affordable) levels after the bust.  It seems especially wrong-headed for us to be afraid of mortgage credit when the median household in Detroit could buy the median home with a conventional mortgage and payments would only require 10% of their income.

Source
I think the problem in Michigan wasn't a problem of too much credit.  It was a problem of too little income.  Mian and Sufi describe the early rise in unemployment in northern Indiana because of the failing RV industry.  In this graph, we can see how unemployment in Detroit was elevated during the boom.


Source
In the next graph, we can see that in late 2005, coincident with the inversion of the yield curve, expenditures on new motor vehicles dropped sharply.  The 2006-2007 period was a sort of minor recession with full-employment for the rest of the country, because deprivation was focused on housing.  Homebuilders are spread throughout the country.  And, households either escaped the cost of rising rents by being owners, or experienced the pre-recession recession through higher costs, not through lower wages or the unemployment that tends to accompany negative wage pressures.  But, this was not the case in Detroit, because the pressures on fixed investment and expenditures on durables were focused on Detroit, where there is a concentration of producers.

By the way, to the extent that employment in Detroit is a signal of our hobbled credit markets, the recent tick up is not such a great sign.

Source
The bust in Detroit, therefore, had a different quality than the bust in the rest of the country.  In Detroit, the collapse in incomes clearly came before the collapse in housing market.  If only the rest of the country looked like Detroit, we might have been willing to accept stimulus in 2006 when we could have avoided a crisis.

Source
Here are two maps of foreclosures in 2007 and 2009.  In 2007, the area around Detroit is the core of the foreclosure problem.  Outside of the Detroit area, foreclosures were not elevated at that time.  We can see here that cities like Dallas and Charlotte - pure Open Access cities where building was strong - had slightly elevated foreclosure rates relative to the rest of the country.  But, nothing outside of the Detroit areas, as of June 2007, would create concern.  Remember, the subprime origination market had already collapsed by this time.

In June 2009, Detroit still looks bad.  Places like Dallas and Charlotte still looked about the same as they had in 2007.  But, now, the core of what really became known as the housing bust is clear in Florida, Arizona, Nevada, and California.

In Detroit and its surroundings, there was never a housing bubble.  Price fluctuations were based on localized factors.  And, in that area, the bust happened in the normal way.  Employment and incomes collapsed first and economically stressed households couldn't make their mortgage payments.

The rest of the country was either Open Access, where home prices and foreclosure rates weren't fluctuating wildly, or was Closed Access (or a contagion area), where foreclosures followed after home prices collapsed.

In this last graph, we can see the relative decline of incomes in Detroit.  In 1979, Detroit still had higher household incomes than San Francisco.  From the peak in 1999 to the peak in 2008, the median income in San Francisco increased by more than 23% while it increased in Detroit by less than 7%.  This, despite the fact that San Francisco was the epicenter of the tech sector, the cause of the drop in incomes after 1999.  Median household income in Detroit - nominal income - has only just now surpassed the 2008 level.

In a few decades, when other cities are able to compete and the source of its economic rents weakens, San Francisco may be the blue line on that last graph - a city with homes in search of jobs instead of a city with jobs in search of homes.

PS: pithom makes a good point in the comments that oil prices were rising at the time that auto sales were falling, so that I shouldn't get too excited about credit as a causal factor.  That's true.  Although, Mian and Sufi using the Detroit housing market as a prominent example of the housing bubble in House of Debt remains an oddity in either case.

Tuesday, February 23, 2016

Housing: Part 120 - We are the austerity counterfactual

The other Anglosphere countries generally had a housing boom, like us, but without the bust.  We are the outlier because of the bust, not because of the boom.

Here are graphs from the Economist.  The first is for Home Prices in real terms.  The second is for Home Prices / Rents.  In both cases, the figures are just indexed, and if you look closely, you can see that they understate the price movement of the other countries, relative to the US, in the Price/Rent graph, because they are at lower levels in the earlier years.  This is especially interesting in the case of Canada and Australia.  These are countries known for having nothing but space.  Yet, they have managed to create a supply problem in their housing markets.  The value of dense cities and the seemingly universal refusal to build in them in the Anglosphere countries has led to land, land everywhere, and not a spot to live on.

Before the crisis, we were the winner of the bunch, because we still have Texas, Arizona, etc.  We have some economic opportunity in places willing to build houses.  But, America, of all places, needlessly lost faith in our financial sector, and imposed austerity on ourselves.  Isn't it weird that, in America of all places, even the pundits and economists who rail against austerity seem to only want public debt.  There is near unanimous agreement in this country that we just can't handle debt privately.  No.  With regard to the private sector, we're all in the austerity camp.

Here is a graph comparing household debt, as a percentage of GDP, for Canada, Australia, and the US.  I have used Federal Reserve measures for the US to get a longer time series, but the measure is the same as the one for the other two countries.


Source
The US breaks from the trend of the others after the bust.  This suggests that US household debt levels are about 30% below where they would have been if we had followed the other countries.  I actually think that debt has accumulated everywhere since the bust because the bust has exacerbated the savings glut problem which has pushed interest rates down.  So, maybe if the bust hadn't happened, the other countries would have seen debt levels slightly lower than they are.

But, in any case, US mortgage leverage is about back to the comfortable range it was in before the bust.  We probably need about 30% growth in home values and in mortgage levels to get back to equilibrium values in housing.  It could be that more than 10% is from a real decline in available housing stock because of our decade long homebuilding depression.  But, as we see with the metropolitan area data, since housing demand becomes inelastic in the face of supply constraints, if anything, the housing shortage has inflated the equilibrium value of the existing housing stock.  I think it is possible that we need to see prices move up by that much in order to trigger enough new homebuilding to reverse course and create a housing stock that is affordable again.

That probably also means well over 1.5 million units per year for a while.  I doubt we will allow either those prices or those quantities to develop.  But, I think, ironically, that is the only way, in the long run, along with urban development reform, to reduce the absolute level of household debt.  The irony is that if San Francisco and Manhattan were filled with high rise condo buildings and Phoenix and Dallas had thousands of new 3,000 square foot homes for median income households, debt levels would be much lower.  The only sustainable macroprudential policy is abundance.  There is no political faction currently in favor of true macroprudence.  But, boy are we all excited about "getting tough" on people.  Wall Street would just love to make us more like Canada.  They see billions in profits from moving that green line up.  Just let 'em try.  We're gonna "get tough" on 'em if they do.  We're no chumps.

Monday, February 22, 2016

January 2016 CPI

Well, I'd say this is a good development.  It looks less likely now that we will be tricked by high shelter inflation into a deflationary shock for the rest of the economy.  Non-shelter core inflation seems to be trending up now.

Here are my graphs for core inflation, with and without shelter, updated.  I don't think we are totally out of the woods.  In some ways, I think we are basically in a similar position as late 2007, but without the housing boom.  Then the Fed appeared to be loosening, and inflation recovered while the economy appeared to be stabilizing.  But, by the end of 2008, we discovered that things weren't nearly as stable as we had thought.

I think something like that is still a possibility.  It is still the case, as it has been for the better part of 20 years, that inflation is being pushed up by supply constraints in the housing market.  This will still cause the Fed to tighten monetary policy to a level below their stated targets.  Since 1997, non-shelter inflation has really fluctuated around a stable trend of about 1.5%, generally moving between 1% and 2%.  But, the Fed stance has shifted to a more hawkish posture, which seems to treat 2% as an inflation ceiling.  If shelter inflation remains above 3%, Core minus Shelter inflation may range even lower as we move forward.

I think the market tends to share this concern.  Friday, the Eurodollar yield curve flattened somewhat on the news.  The short end of the curve moved up about 3 basis points, but the long end of the curve moved down up to 5 basis points.  My model had shown an expected second rate hike as late as the end of 2017, last week.  This has moved back to about April 2017 now.  But, the slope of the curve after the hike continues to flatten.  It is so low that now, after the expected rate hike of April 2017, rates are expected to rise by only 1/4% per year!  This is essentially a flat yield curve.  I hope there is enough strength in the economy for recovery to continue.  Recent dovish comments from some Fed members are heartening.

Here are some long term graphs of shelter inflation, by region.  The two Americas come across pretty clearly here.  The first graph is the ratio of Shelter price levels to the price level of Core CPI less Shelter.  Rent prices in the Midwest and the South have risen fairly closely to Core CPI prices.

The Northeast has had unusual rent inflation since the late 1980s.  Rent inflation was pretty normal in the West, along with the South and the Midwest, until the mid-1990s.  This is when the urban housing shortage kicked into gear.  Since the mid-1990s, rents in the West have grown at a faster rate and have been more volatile than the other regions.

The last graph shows Trailing 12 month Shelter inflation for each region.  Here we can see that rent inflation shot up in all regions after housing starts collapsed in 2006, though the Midwest didn't rise quite as sharply.  Regional rent inflation tends to move somewhat independently.  But, at the beginning of 2006, there was a singular outside force that caused rent inflation to shoot up across regions at a similar scale.  A sharp negative shock in credit markets caused a sharp negative shock in housing supply.  Then, by mid-2007, the credit crisis had begun to drive home prices down, leading to defaults and foreclosures.  By then, households were sharply reducing their housing demand because they were literally losing their houses, and moving into whatever unit they could manage.  This sharp decline in rent inflation, and the initial recovery from it, were also both quite uniform.

Now, we are going back to a context where regional differences are more important, and rents in the West are shooting up more than in the other regions, although our continued War on Credit means that there is a lack of supply in all regions, so rent inflation is high in all regions.

Friday, February 19, 2016

Should I be bullish on manufactured homes?

I'm mostly on the sidelines regarding the housing/treasury position until the smoke clears a little more on mortgage expansion.  In the meantime, I noticed that manufactured homes just had their best quarter is quite some time, with unit sales up about 20% over last year.  Could this be the outlet valve for some of the pent up demand for housing?

SAAR, monthly
Manufactured home sales are well below previous norms.  It seems to me that sales could easily double from here, or more.  And, if financing might be able to expand since much of it is outside the traditional bank-held or conventionally securitized mortgage market, maybe manufactured homes get a boost for households without other options.

I might have to look into this.

Comments welcome.

Thursday, February 18, 2016

Housing: Part 119 - Review of Household Debt and Credit Report

Yesterday, I referenced the potential influence of the bankruptcy reforms in 2005 on the apex of the housing boom, including possible evidence for the more intense late-boom price swings in Arizona, Florida, and Nevada.  Today, I will look at a few more graphs.  I have looked at these before, but I think there is some new significance related to recent additions to my overall narrative.

First is the graph of mortgage originations, by FICO score.  As my version of events is shaping up, I think we can see a couple of distinct events.  Now, I think we can probably pin down the sharp decline at the end of 2003 on the accounting scandals at the GSE's and the subsequent pressure on them to play it safe.  Note that the decline in originations at that point is weighted, oddly, toward the higher FICO scores.  These are the borrowers who would have been using GSE loans.

In the following graph, we can see that FICO scores were actually rising until 2003.  They fell until early 2007.  But, we can see here that, (1) typical FICO scores of borrowers were still within recent norms, and (2) the decline did not come from a surge of low FICO score borrowers, but from the decline in high FICO score borrowers, probably due to the decline in GSE activity.

Also, it is likely that as short term rates rose from 2004 to early 2006, high FICO score borrowers were engaging in fewer opportunistic refinancings.

In the last graph, we see delinquency levels, by state.  I have scribbled in the point in time where funding for subprime loans had completely dried up and AAA subprime securities were trading at a discount.  By this time, there had been distress in the subprime funding industry for a year or more.

I am currently reviewing Gary Gorton's work on the crisis.  He points out that subprime borrowers and lenders depended on the ability to refinance.  A lot of observers have discussed the problem of teaser rates and rate resets.  But after the run on shadow banks, there were basically no subprime loans available.  Many of those defaults after mid-2007 were related to negative equity.  But, even if those households had been willing or able to refinance, there simply was nobody to borrow from.  Should teaser rate resets have become a problem?  Maybe.  But, really, there is no way of knowing, because the liquidity crisis removed the option of refinancing, even for households who might have reasonably expected to be able to refinance.

Wednesday, February 17, 2016

Housing: Part 118 - Bankruptcy Reform in 2005, Another in the Chain of Credit Shocks

I was looking at the latest graphs from the Quarterly Household Debt and Credit Report.  Looking at this one:

I realized that I had not looked into the effects of the 2005 Bankruptcy Reform Act (BAPCPA) on housing markets.  Note that it came into effect right at the top of the housing boom.

And, it turns out, there are at least a couple of papers on this topic.  One from Donald P. Morgan, Benjamin Iverson, and Matthew Botsch at the New York Fed, and one from Ulf von Lilienfeld-Toal and Dilip Mookherjee.

The effects of BAPCPA included making it more difficult for some households to use the homestead exemption in bankruptcy.  So, before BAPCPA, households would consolidate their wealth in their home equity and seek relief on their unsecured debts.  The passage of BAPCPA lowered some of the implicit value of homeownership, especially among highly leveraged or economically stressed households.

Both papers find significant correlations between home price movements before and after 2005 and the scale of the homestead exemption.  Here is one chart on the difference between states, from the L-T & M paper.  Home prices rose faster in 2004 and 2005 in states more affected by the law and then declined more sharply after the law was in force and mortgage defaults became more common in bankruptcies.

Among the states with high homeowner protections: Nevada, Arizona, and Florida (although some states that did not experience extreme price movements, like Texas and Oklahoma, also have strong protections).

It seems that this might have increased demand for homeownership in 2005, during the rush of bankruptcies and then decreased the demand for homeownership after 2005.  Also, it has made it more likely for households to default on their mortgages, as opposed to their unsecured debts.  Additionally, L-T & M find contagion effects in geographic areas with large numbers of bankruptcies.

Tuesday, February 16, 2016

Housing: Part 117 - The canary had it coming

Scott Sumner references this nice summary, on Facebook, of the market monetarist argument, by Eliezer Yudkowski.  (Well, a long summary.)

One of the comments was: "I think I finally understand why so many people keep saying inflation is a good thing.  I still disagree, because it seems to be mostly for the benefit of foolish people who haven't saved enough for deflation to be helpful to them."  This seems to be a common theme among monetary hawks and populists.  Monetary stability is a bailout for irresponsible speculators.

A century ago, populists held the opposite view.  William Jennings Bryan made a political career out of demanding inflation for the common man.

Think of all those irresponsible, greedy 19th century banks.  Some farmer waltzes in to their loan office in the spring and says, "Hey, if you loan me some cash now for seed, I will pay you back, with a hefty profit, in the fall, when I harvest."  And, banker after banker, with dollar signs in their eyes, agreed.  Never mind that for this unlikely speculation to be sustainable, they needed to depend on the farmer to get out of bed each morning to plant, weed, fertilize, and harvest.  They needed to assume he would be healthy and functional throughout the summer.  Oh, and there needed to be some rain the spring, but not too much.  Don't forget that hoards of insects infesting whole regions was not uncommon at the time.  The farmer would need to time just right when he planted and harvested to account for fickle and unpredictable weather.  Compared to our defunct subprime mortgage originators, Bryan's agricultural bankers were daredevils.

The whole system was built on a façade of greed and over-optimism.  And Bryan wanted to just come along and bail out the farmers who were foolish enough to put themselves in a position where deflation would hurt them.

Here's the problem.  The most leveraged, risky economic participants will always be the first harmed in the face of an economic shock.  Our obsession on this fact has led us, maddeningly, to a place where economic stability, itself, is now considered to be a moral hazard issue.  This is why I think our current economic policy is a policy of self flagellation.  There is a plurality of support in this country for imposed self-harm, explicitly because it harms those people who are most vulnerable to potential harms!

It's even worse than that.  The problem at the core of finance is the intractable comingling of desert and luck.  In a world of abundance - of extended education, saving, and retirement - we are all like Bryan's farmers.  And we're not comfortable with it.  Many households, faced with the dilemma that the privilege of living in California means spending 35% or more of their incomes on rent, decided that ownership, even leveraged ownership, was a useful hedge of that high and uncertain cost.  They experienced the modern equivalent of a farmer's ill-timed flood.  And, come to find out, our public policy was to seed the clouds.  And, when some of us yell, "Stop it!  This is harming people."  The response is, "How else will they learn?  They keep borrowing money to plant their seeds, assuming they will have a hearty harvest in the fall.  They need to understand that crops can fail.  How will they understand that if their crops don't fail?"

And, just like Bryan's farmers, it seems as though whenever thing go sour, whenever the risks we exposed ourselves to turned against us, there's a God damned banker doing the devil's work.  The banker made the loan that ended up failing, and the banker demanded the keys to the house when the farm was auctioned off.

Bryan hated the banks, too.  But, he wished to push the harm to them through the soft default of inflation.  Today, we won't settle for that.  We want hard defaults.  Lessons need to be learned.  Even our progressive president has peopled the FOMC with monetary hawks.  And, shelves full of books about the inevitable housing bust complain that we should have bailed out the borrowers instead of the banks.  OK.  How about some monetary support so the bust wasn't so inevitable?  I'm not even talking about hyperinflation.  What if we had just mimicked the policy regimes of the 1980s and 1990s, when home prices fell in real terms, but were relatively stable in nominal terms?  Meet Bryan halfway.  But, nothing but a bust will do.  We imposed this on ourselves, and it's not even controversial.  The median household can barely get a mortgage today.  Where is the outrage from the median household?  Nothing is so damningly pro-cyclical as public sentiment and public policy.

Our proverbial fields lay fallow because many housing "farmers" can't even fund their "seed", yet the political winds demand monetary contraction, for fear of a too-abundant harvest.  If eating requires credit, we resolve to starve, valiantly.