Thursday, August 13, 2015

2015 2Q Household Debt and Credit Report

Source - only updated through q1
The 2Q report is out.  Interestingly, in the second quarter there was a solid jump in mortgage originations, but at the same time, total mortgage debt is declining again, after having stabilized since about 2013.  Total mortgages on consumer credit reports dropped at an annualized rate of almost 3%.

Source
I think we are seeing the confluence of several factors.  Originations are growing, but they are still very low.  They are still below even the temporarily higher levels of 2013.  And, obviously, they are much lower than pre-crisis levels.  So, they are having some positive effect on real estate markets, but nothing we would have called bullish before the country lost its mind about this stuff.

At the same time, we are seeing the long end of the tail of underwater homeowners coming back into positive equity.  We are also seeing the continued recovery of the labor market, which is associated with more churn - more quits and hires.

And, we also have seen an acceleration downward in homeownership in the last few quarters.  I think all of this adds up to a picture where housing and labor markets are finally reaching a full recovery level where frictions have been reduced.  Homeowners who want to move are moving.  Workers who want to test the market are moving to jobs with more opportunity.

But, since so many existing homeowners cannot qualify for mortgages in today's context, these healthy developments have the ironic effect of chilling the single family home market and mortgage credit markets.

Source
I have been preparing for the idea that a bearish market and falling interest rates would be somewhat easy to detect because of apparently predictable signals in the yield curve.  I thought that might happen after mortgages recovered more.  Yet, here we are with long term rates falling, inflation expectations falling, and the Fed signaling that they are tightening...And I can't pull the trigger and go long bonds.  It would just take one meeting, for Yellen to come out and say, "Uncle".  We're backing off.  Don't worry about tightening.  But, we just keep going down this road.  And, it just seems so crazy that this is where we are, I just can't believe that we would take these downside risks.  Surely, they will come to their senses.


Source
Surely, the entire country, at some point, with home ownership at levels literally not seen since the founding of HUD, will forgive ourselves for our imagined sins.  Surely, at some point, we will collectively decide that it's ok to own a house again, that it's ok for bankers to be bankers.  How many years of purgatory have we consigned ourselves to?

I think it is interesting to look at the graph of the distribution of FICO scores and the graph of mortgage originations.  The median FICO score is around 710 to 720.  The median household has been a homeowner for 60 years.  Now, look at the mortgage origination graph.  There is no way that homeownership can remain above 50% without a sharp loosening of credit.

I also think it is interesting to look at the FICO score distributions.  There is surprisingly little variation over time between 2005 and 2013*.  The median score never left that 710-720 range.  I have seen some reasonable discourse on the housing boom that suggested that the reason FICO scores didn't decline as much as the "predatory lender" cause would suggest, on mortgage originations during the boom, is because FICO scores were inflated by rising home values that allowed households to avoid debt problems.  But, the FICO score stability shown here suggests that this could not have been that strong of a factor.


* The source link goes back to 2005.

Monday, August 10, 2015

July 2015 Employment

Just a quick review of employment.  Flows into and out of employment are now at levels that correspond to previous labor market peaks, when the unemployment rate was 4% to 4.5%.  Flows between unemployed and not in labor force are still elevated - signaling an unemployment rate closer to 6%.  We are well into a full-employment labor market, with an appended group of marginal workers.

I wonder how much of this marginal worker problem would disappear if mortgage levels began to expand again, leading to homebuilding.  The construction unemployment rate has fallen back to full-employment levels, but the total amount of construction employment remains about 0.5% to 1% below the level that it was in any previous expansion period.  That just happens to match the difference between the unemployment rate levels implied by flows.  Have we kept the construction market so dysfunctional for so long that construction workers identify as marginalized workers now instead of as unemployed construction workers?

In effect, our wage growth is going to landlords instead of to construction workers.  I know I'm a broken record on this stuff, but it is amazing to me that with all the concern over wages and marginalized workers, there isn't an uproar about the lack of mortgage funding and building.  Is there a single presidential candidate who dares to even give rhetorical support to mortgage expansion and homebuilding?

Nothing is so pro-cyclical and "bubble" prone as public political opinions.

Saturday, August 8, 2015

Housing Tax Policy, A Series: Part 52 - Housing, Human Capital, and Income Inequality

An interesting paper has reminded me that I need to update some prior speculation about housing and incomes.

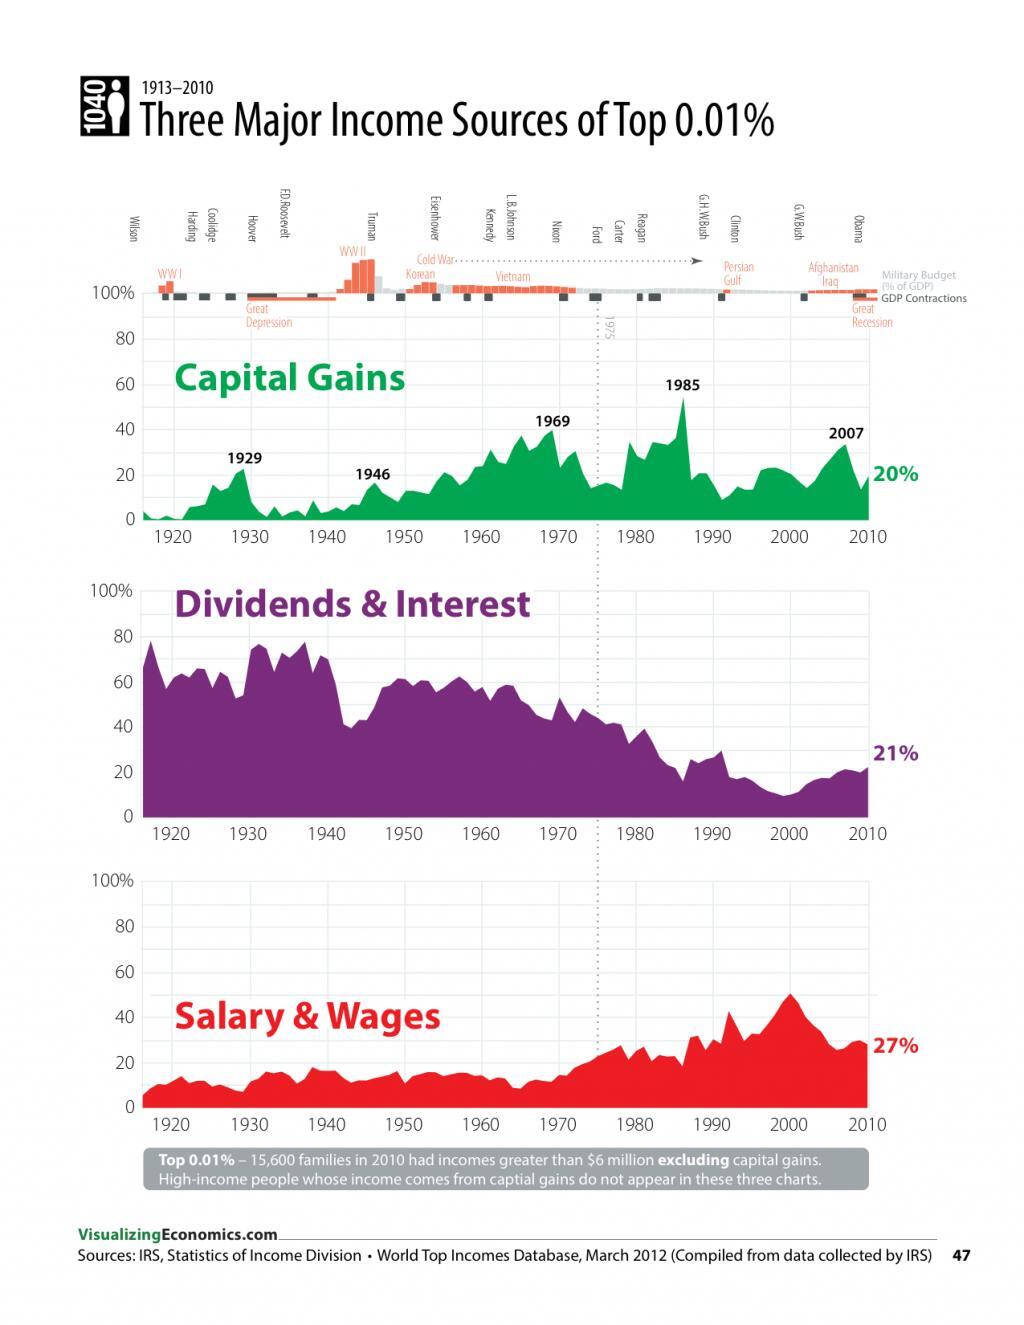
First, here is an interesting graphic I recently saw (HT: Utopia you are standing in it).

This drives home a point about the current economy.  Contra Picketty, etc., the top-heavy distribution of incomes is not coming through either increased concentration of capital ownership or higher returns to capital.  It is largely due to a concentration of high salaries and wages.

I have spilled some digital ink speculating about how much of the current economic landscape is due to the growing importance of human capital.  I think this can be a cause of the rising level of investment in real estate, the rising level of risk premiums and associated decline of real interest rates, and the sense of economic insecurity.

Since I have come to realize how much of the rise in home prices is coming from higher rents, especially in a few large metro areas, I need to adjust my understanding of this issue.  I had originally seen the rise of home prices mostly being a product of lower real interest rates, and those lower interest rates are partly a reflection of the increase in returns to human capital (both prospective and earned).  Human capital is an especially illiquid, risky, and non-diversifiable form of capital.  As it becomes larger, relative to physical capital, the demand for low risk assets will rise.  But, if the rise of home prices is mostly related to rising rents, then while this human capital development is still a reasonable factor, it is not as large of a factor as I might have believed.  Further, if the limit of housing stock is itself creating a drag on available investments, the housing supply issue could even explain some of the decline in interest rates.

I've mentioned before that this paper from James Galbraith and Travis Hale attributes most of the rise in income inequality since the rise of the tech. boom to four counties - basically Manhattan, San Francisco, and San Jose.  Human capital is highly concentrated in these cities.  But, regarding the problem of housing and rents, these cities also happen to be centers of extreme limitations to housing supply.

This new NBER paper from Chang-Tai Hsieh and Enrico Moretti may pull together these issues (HT).  They estimate that the housing supply problem (almost entirely from these 3 cities) has cost us nearly $2 trillion in annual GDP - equal to nearly $10,000 per year in compensation income per household.  They utilize some fairly complicated economic reasoning, so please correct me in the comments if I have some subtleties wrong.

Basically, cities in general tend to lead to higher productivity.  The frontier of technological and financial sector progress and production is heavily represented in these cities.  If there was not a constriction in housing supply, this would lead to an expansion of employment in these cities, as firms and workers move in to gain from the geographical advantages that the cities hold.  Since there is constricted housing supply, much of the added productivity is captured by workers in these cities and by real estate owners.  Effectively, there are rents earned, first, by real estate owners, due to the constriction, but also, by workers, because the lack of residential housing means there is also a lack of people - of labor.

This attracts high productivity workers to these cities, because they are most able to gain from these rents, and it also makes incomes in these cities higher than incomes in the rest of the country.  And, some of those higher incomes must go to rent expenses.

In effect, this relates to Paul Krugman's work on geography.  Geographical areas can attain certain persistent economic advantages.  Think of Detroit and the auto industry.  In many cases, factions find ways to claim these economic rents so that the advantages accrue to residents as excess income instead of leading to population influx.  In these cities, some of this is playing out through the housing market.

The model constructed by Hsieh and Moretti suggests that a reasonably elastic housing supply in these cities would have led to the movement of tens of millions of workers.

The housing problem in these cities could explain a large portion of the income inequality and income stagnation that has been so widely discussed recently.  And, there could be some causation going both ways.  I have discussed how the development of human capital could lead to an increase in housing capital.  But, most of the causation could be going the other way.  The problem of housing constrictions could be allowing some wage earners - especially highly productive wage earners - to capture more of the output of their work.  I have identified it as returns to human capital - and it is.  But, it might be more precisely called excess returns to human capital.  A more accommodative housing stock might help to reduce these excess returns, decreasing the variance in wage incomes and spreading the benefits of improved productivity more broadly through the country and the economy.

I think this direction of causation actually makes more sense than my original interpretation, because if I was right that the development of human capital was leading to more savings into housing, we should see an increase in real housing expenditures relative to incomes.  Instead, we have seen rent inflation and a sharp decline in real housing expenditures, even as nominal housing expenditures have remained fairly level.

We can estimate some of the cost of the housing supply problem with the excess rent claimed by metropolitan housing.  But, that only estimates the loss of real income claimed by real estate owners.  This paper suggests that real income is also reduced by the lost productivity from the exclusion of labor from these cities and the transfer of consumer surplus to metropolitan labor compensation.

Wednesday, August 5, 2015

The Minimum Wage, Sunk Costs, Returns, and Capital

I have previously thought through the implications of minimum wage hikes on an industry through a finance lens.  In the end, going through that process has brought me to the conclusion that, (1) markets with relatively open access at an aggregate level and uncertain but persistent returns on investment can be competitive in the aggregate while individual firms appear to have excess profits (reflecting monopoly or monopsony rents), (2) the effects of MW increases on the labor force will eventually play out through capital destruction and reallocation, so that the employment effects may not have a shape that is particularly different from other shocks to labor utilization, and (3) there is a "part of the elephant" element here, where you would find no effect, disemployment, or even employment growth, depending on what part of the market you measure, even though we would expect net employment loss, or more precisely some employment dislocation and capital destruction.  Some of that loss - maybe even most of it - would come from outside the industries directly involved in minimum wage labor because the net effect would result from capital reallocation, and some of that capital may be reallocated out of other industries, into industries that have eliminated minimum wage workers.

So, the only way to fully capture the employment effects of a MW hike may be to look at the total labor market, but the effect at that level will frequently be too diffuse to measure with significance.

If this is confusing, please check the link above.  That post is probably a prerequisite for this post.

A narrative version of an industry we might think about would be gas stations.  We might imagine two stations at an intersection.  When they originally locate, both have equivalent expectations of their returns on capital.  But, once they locate there, traffic patterns will emerge which were not originally predictable.  These might favor one station over the other.  So, one station owner will experience persistently higher returns than the other one.  Another station could locate on another corner at the intersection, or at a nearby intersection.  In this way, the market for gas stations would be competitive, even though these stations have persistently different outcomes.  So, the station with the better returns would appear to have monopoly profits, but really they are balanced out by the low returns of the other station, so that the average returns for the two stations would still be a reflection of competitive expected returns for this type of investment.  And, the occasional failure of the weakest firms creates survivorship bias that makes the profit level of the entire industry appear to be higher than competitive returns would be, even though the profit on all of the invested capital would not.

This is basically portfolio theory applied to an individual industry.  At the level of equity portfolio management, we all understand that some stocks perform better and some perform worse, but that the average returns to equities over time reflect some underlying required return that the marginal investor demands.

Here was the final graph from that earlier post.


The end result was a loss of jobs at the weakest firms and an expansion of the remaining firms plus an inflow of capital from other industries to re-establish a new equilibrium that re-attains the original expected ROI of the industry for marginal new investments, at a slightly lower total aggregate employment level.  This means that a small number of firms in the industry fail, a large number of firms in the industry expand slightly, and some capital is reallocated from other industries into this industry to replace some of the lost firms.

Using our gas station narrative, several weak stations may fail, the remaining strong stations may add pumps or workers when they see added traffic as a result, and a few new stations that use self-serve kiosks may open up.  These new stations may have largely been uncompetitive when the market included weak firms with low wage employees, but now with fewer stations and higher wages at those stations, these stations would be more competitive.  Some observers make the claim that this inflow of capital is a positive outcome of minimum wage hikes, but I think this is an error.  The MW hike can't create capital, it only causes capital to be reallocated from some other use.  So, we now have a gas station with kiosks instead of a station with an attendant.  But, the creation of that station means that we don't have a car wash that the new station's owner had intended to open before the MW hike changed the competitive context.  Essentially, we have destroyed capital that was being profitably deployed in the beginning context (the weak station).  So, the MW heavy industry may be slightly more productive now because of the new capital, but some other industry is less productive as a result.  The net post-MW hike productivity must overcome the destruction of the capital in the lost station, so it seems to me that the net effect of the MW hike is very likely to hurt aggregate productivity.  We used the same amount of capital, but now we don't have a car wash and we do have some unemployed former gas station attendants.

Regarding the question of whether capital is a substitute or a complement to labor, it seems to me that the sorts of capital adjustments created by MW hikes will make capital more of a substitute for labor, lowering labor's total share of production.  And, in my narrative example here, we do see that the higher MW doesn't affect the total amount of invested capital or the return to capital (Losses to the weak station are countered by gains to the other station and the new station.) but it does lower total production (There is no car wash.) and employment (the employees of the failed station).  The loss in production comes from the decline in labor.

Thinking through all of these changes we would see:

1) A loss of employment across the wage scale at the few firms which fail.

2) Higher wages specifically for the minimum wage workers at the remaining firms, representing almost the entire industry.

3) Higher prices at the remaining firms, which would appear to both observers and industry managers as a result of "passing the costs on to the customer" as the result of some sort of market power, but in the aggregate would really just reflect the new context introduced by the changing cost structure and marginal loss of competitors.  Even in a perfectly competitive industry, I think there would be some change in the mix of price and quantity, simply reflecting various elasticities.  In effect, this is just another way of saying that the destruction of capital leads to lower real incomes across the economy (and one way that change is conveyed, assuming stable nominal incomes, is through higher prices in the affected industry.)

4) Some marginal level of new capital would be attracted to the affected industry, leading to some marginal addition of new jobs in the industry (likely at higher wages because the failure of some firms with low wage business models may allow the introduction of business models that didn't depend on low wage structures) and some loss of new employment outside the industry because of this capital reallocation, which would be very difficult to notice and would include an indeterminate range of wage levels.

Regarding points 3 and 4, it seems as though, if demand for the given product is very inelastic, prices will rise substantially and capital will be reallocated into the affected industry, so that the loss in total consumption would come from outside the industry.  If demand is very elastic, production and employment within the industry will fall, and capital will be allocated outside the industry, as it would have without the MW hike, and the loss in total consumption would come from a decline in the production of the affected industry.

So, there would be a dislocation of labor and a loss of productive capital.  But, we could see an inflow of capital into the industry, profits at remaining firms apparently bolstered by higher prices, the vast majority of MW workers at the time of the hike keeping their jobs at higher wages, and possibly even expansion at some remaining firms.

So, I think there are a couple of implications here.  One is that, even though the net effect would be negative in the short run (through the dislocation) and the long run (through capital destruction), there would be many ways to measure significant positive outcomes.  But another is that this policy may not have implications that are especially bad for the most vulnerable workers.  The job dislocations may be spread throughout the wage spectrum, so that most of the gains go to the vast majority of MW workers who keep their jobs, and most of the dislocation falls on non-MW workers who lose their jobs and on consumers through higher prices within the affected industry and through the loss of new production outside the industry.

Maybe, compared to the way I have thought about MW hikes, the negative effects fall on the most vulnerable workers in the same way that negative effects always fall most harshly on the most vulnerable, not because the negative effects of the MW themselves end up being focused on vulnerable workers.

In effect, all of the seemingly contradictory findings may be true.  Maybe, on net, MW hikes damage the labor market as a whole to the benefit of most existing MW workers.  So, maybe the debate about the policy is not particularly unique.  Maybe this creates some persistent downward redistribution, some dislocation, and some loss of growth, and the question is about the whether the scale of those effects is positive, on net.  I tend to come down against dislocations and lower growth, but I might think twice about assuming that the negative effects of MW hikes are absorbed by low wage workers particularly more than they are in other interventions that generally reduce growth or create labor dislocations.

Of course, one other factor that I haven't considered here is the extent to which demand for entry level workers is permanently depressed or that some very low productivity workers are permanently locked out of employment.  There are unfortunate cases where special labor arrangements for physically disabled or learning disabled workers are made illegal by these laws, or where labor markets in places like Puerto Rico or American Samoa are especially hurt.  As a national minimum wage level increases, the range of places that would be especially hurt in this way would expand.  It is probably important to keep in mind how strongly income levels correlate with labor force participation.  Here is a great interactive map from the Census Bureau that really drives that point home.  We fret over aggregate changes in labor force participation of a few percentage points, but the difference in LFP between neighborhoods can be very sharp.  (Click on the link for a larger version.)

In the long run, workers are still going to tend to acquire work with wages proportionate to their productivity.  Even if that is an extremely inefficient process, the consequences of lower broad levels of labor productivity will tend to accrue to the most vulnerable and least skilled.  The fact that these jobs tend to have higher turnover than higher wage jobs accelerates that process.  As with most policies, it seems that "We are the 100%." holds.

Housing Tax Policy, A Series: Part 51 - Housing and Strong Form IMH

Tyler Cowen generously posted a comment I had made about supposed short-term bias in financial markets.  My point was that there is an apparent contradiction between the idea that (1) short-sighted investors consistently push firms to massage quarterly numbers and invest for short-term profits over lasting long-term growth and (2) there was a speculative bubble 15 years ago based on a group of firms that had never been profitable and had no near term plans for being profitable.

The commenters on his post generally balked at the idea, noting that there can be investors who are short-sighted at the same time that there are investors who are overconfident speculators.  This is well enough, as far as it goes.  The distinctions here are subtle, non-falsifiable, and are about scale.  Of course there are ebbs and flows in investor sentiment, and of course at any given time there are investors with many different sentiments.  But, the problem is figuring out when these sentiments become such an influence on price that markets become adversely inefficient.

My reaction is that there appears to be a lot of motivated reasoning against finance.  We are uncomfortable with conspicuous profit from risk.  Speculation is unseemly.  It seems like it must reflect our baser motives.  So, to my eyes, there tends to be a pretty obvious predisposition for finding fault in financial markets.  This is in stark contrast to the way we should feel.  Speculation is what I do for a living, and, despite a fairly strong history of success, in my weaker moments I am almost embarrassed at myself for thinking that what I do is possible.  There are millions of people in the world diligently (even greedily) searching for mispriced securities, including many highly trained, motivated, and intelligent people.  The hubris required to bet against them is damning.

A complicating factor on this question is that securities with the longest time frame are the ones that are most vulnerable to small changes in expectations (discount rates, growth expectations, etc.), so, in a way, the popular notion of imagining speculative fevers in long term securities can be attributed to the seemingly contradictory complaint of short-termism.  Markets in those long term securities can become volatile when those sensitive variables change, and cynical observers can attribute the changing prices to short term speculation.  So, in the 2000s, when households were investing large sums into, perhaps, the longest-lived security of all - homes - a consensus explanation didn't build around the idea that forward-looking households were scrupulously investing their incomes in their homes, in a mass attempt to create a long-lasting financial safety net.  Instead, the consensus reaction was that the housing market was dominated by short-term speculators with unhinged expectations.

In the end, public policy was, itself, affected by this consensus, and we created a classic, monstrous example of strong form IMH (Inefficient Market Hypothesis).  Those unhinged speculators clearly pushed home prices beyond their reasonable levels, so when home prices eventually collapsed so far that the economy followed, we told ourselves that this was our medicine.  It had to be done.  To engage in any policy that might even indirectly support home prices would be driving them back to those inappropriate levels, and, furthermore, it would prevent those speculators from learning a lesson about greed and overconfidence.

It is strong form IMH because it looks exactly like that is what happened.  It's not crazy to think that this story is accurate.  There are certainly enough reasonable pieces of evidence to confirm it.  So, the self-imposed public policies that popped the bubble prove themselves to be appropriate by creating a believable, yet inevitable, outcome.  There is no way to steer a public that insists on viewing our financial selves as inherently unstable away from this self-imposed destruction.

But, what if those long-lived assets really aren't being driven by manic short term speculative fevers?  What if households are investing for long-term income, and it really is a contradiction to imagine that we are both short term oriented and given to speculative fevers in long-term securities?

Here is a graph of real home yields compared to real equity and bond yields.  (See this post for an earlier version of the graph and descriptions of the method.)  The high inflation 70s mess up the trends, because required returns on equities shot up during that time and bond yields simply adjusted for inflation (using the GDP deflator here) are only a rough approximation of real yields based on a market rate.  The bond yields in the early 1970's are probably understated because experienced inflation was coming in higher than expected inflation and bond yields in the 1980s are probably overstated for the opposite reason.

But, except for that issue, and allowing for some pretty noisy annual growth and inflation data, total real yields to equity (including real expected growth) run along a flat trend of just over 10% while bonds and homes run about 3% to 4%.  If anything, bonds have the least stationary real yields of the three asset classes.  (I used 10 year treasuries here.)  Except for the treasury yields, all of the other yields are derived by comparing incomes and market values from the Federal Reserve Flow of Funds report and BEA tables.  And, we can see that yields on homes (net rent after costs and depreciation, divided by market values) form a pretty straight and level line.

This goes to one of my themes about the housing boom.  Equity valuations are notoriously flexible.  Bond yields (and, thus, valuations) are similarly traded on highly liquid international platforms.  Home prices are sticky.  Rent levels, in the aggregate, change very slowly, and  home prices can't generally rise more than about 10 to 15% per year, because of the illiquid housing market and various frictions in play.  Those frictions can keep demand due to falling yields from pushing prices up quickly, but we did learn in 2007 and 2008 that they can't keep them from falling so quickly when demand collapses.

Here is a more close-up graph of real home yields over time.  These have fallen within a range of about 1 1/2% since 1960.  At the same rent level, a home with a yield of 2.4% would be worth about 67% more than a home with a yield of 4%.  Simply based on cash yields, home yields were just below the historical range in 2006, at 2.4%.

The narrative about over confident home speculators says that home prices got bid up because of undue optimism about price appreciation.  But, let's look at this last chart.  The top line is the income yield on homes plus an additional growth premium.  To estimate the growth premium, I subtracted core inflation from owner equivalent rent inflation to estimate expected real growth in cash flow for the owner.  The premium is the 10 year trailing average of that difference.  (I used Shelter CPI before 1983.)

So, we can think of expected returns on homes as beginning at the top line.  That is the rate of return the marginal buyer expects to earn.  But, if rent inflation is expected to persist, the marginal home buyer will bid up the price of homes until the cash yield decreases enough to counter the value from the expected growth.  (Without some pretty severe supply constraints, there shouldn't be any persistent excess rent inflation, because of natural tendencies for arbitrage over time in land, housing, and mortgage markets.)

There was a period of rent inflation in the 1970s, which subsided in the 1980s, and until about 1995, rent inflation was pretty normal.  So, the 1990s saw both high long term real interest rates and low rent inflation, which combined to make home prices very low.  From 1989 to 1993, home prices fell 14% in real terms, and stayed there until 1997.

From the end of 1997 to the home price peak in early 2006, home prices nationally rose about 110%.  Rent rose 30%, which was 10% more than core CPI.  So, about 1/3 of that rise was simply reflected in experienced cash flow increases.  The required yield fell from 4.1% to 3.2%.  That corresponds to an increase of just under 30% in price/rent.  So, about 1/3 of the rise in home prices can be attributed to falling yields.  And, persistent rent inflation pushed cash yields down from 3.2% to 2.4%.  That corresponds to an increase of  just over 30% in price/rent.  So, about 1/3 of the rise in home prices can be attributed to persistent rent inflation.

Two-thirds of the rise in nominal home prices came, then, from rent.  And, rent continues to rise now that we are past the recession.  I think this demonstrates two ideas.  First, we don't need a speculative frenzy to explain the 2000s housing market.  The rising rents were done.  They happened.  The yields were falling in line with long term TIPS yields.  And expectations of rent inflation were justified by past and subsequent developments.  The rising prices in the 2000s housing market reflect reasonable, income-based long term investing.

Sure, there were speculators.  They were profiting from the frictions that make home prices inflexible, leaving predictable profits when market prices converge with intrinsic value, not from home prices flying off away from their intrinsic value.

The second idea is that real yields are very low for low risk securities in developed economies - not only now, but generally.  For homes, it looks like they tend to stay around 4% or so, which reflects a slight premium compared to TIPS bonds, but is still very low.  And, this is why the housing market should be very efficient, because even a small increase in expected rent cash flows of 1% or less can cause intrinsic values in homes to rise more than 10%, even 20% or 30%.  So, even though the actual buyer and sellers market for homes has high transaction costs, a lot of localized differentiation, and is anything but commoditized, over time we can easily see how there would be a supply response to a 10% to 30% rise in prices that was due to rising rents.  And, there was a supply response where we allowed it.

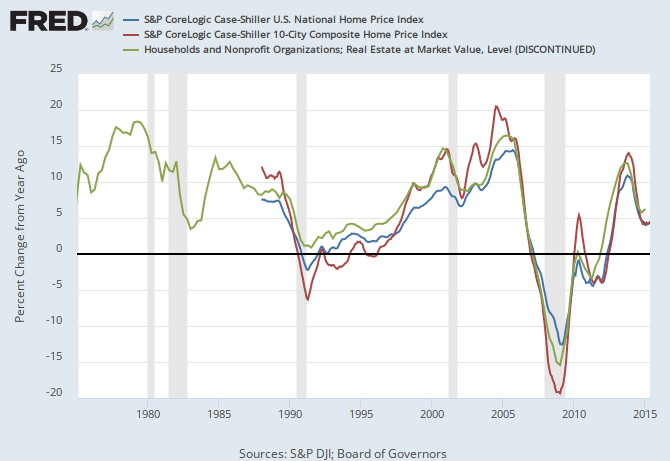
But, this same arithmetic that shows how much we can expect a supply response also shows how extreme the consequences of supply constrictions can be.  Just a 1% increase in excess rent inflation over a decade created a 40% increase in home prices.  In the major metro areas where the constrictions are centered, prices rose 175% from 1997 to 2006.  During that time, rent inflation in the major metro areas was nearly another percentage point higher than the nationwide figure.  So, add another ~30% influence to home prices in the Case-Shiller 10 cities.  Four factors each increasing the price by about 30% and compounding gives us a price increase in the range of 175%.  In the major metro areas, all but about 30% of the rise in home prices can be attributed to rent inflation, mostly arising from these supply constrictions.

So, we have a supply side problem, but reasoning from a price change, together with motivated reasoning that leads us to assume base motives and irrationality from financial agents, leads us to exactly the wrong interpretation.

Financial markets may be the most forward looking institutions ever created.  A small change in the trajectory of our expectations about the value of homes 40 years from now can lead to huge changes in the prices of those homes today.  We have found a way to quantify the investments we make for the future and make them real, today.  And, this success becomes its own enemy, by tricking us into mistaking our most forward-looking selves for wild-eyed fools and flagellating ourselves for it as if in some puritanical historical drama.

------------------------

Brad DeLong has a post up that seems like it relates to this issue.  He argues that "secular stagnation" reflects a monetary-financial problem.  And, since the idea that high asset prices reflect speculative excess is so widely accepted, it becomes a placeholder for his argument.  I don't accept that placeholder, and so his argument appears very strange to me.  He blames low interest rates on the "failure of financial regulation" that "has left us with a set of financial intermediaries who are untrustworthy and untrusted. As a result, they cannot mobilize the risk-bearing capacity of society as a whole to any sufficient degree."

This is strange because (1) corporate assets that bear cyclical risks and higher risk premiums are trading at fairly normal prices.  There doesn't seem to be anything unusual there.  And (2) interest rates are low, in part, because there is a high demand specifically for the securities our financial system produces.  Capital consistently pours into our economy from around the globe and buys up the products produced by our financial sector.  The story seems to me to be clearly the opposite of what DeLong describes.  We have such a high trust financial system that the world is routing much of its capital investments through our corporations and is using our system as the source for lower risk securities.

In fact, our supply problems with housing are undermining this process that has been made available through trust, because some of that capital would naturally filter into our housing markets, and if we had markets that could react with supply, the effect of that capital would have been to build houses where people want to live and to drive down rent instead of driving up prices.  This global capital trade, built on the trust of the US financial system, should have reduced the cost of living of regular American families.

DeLong blames the shortage of safe assets on the inability of US financial intermediaries to convince savers that they can produce securities that have low risk.  Where is the evidence for this?  We aren't suddenly running a huge trade surplus as capital flees our economy for more trustworthy jurisdictions.

Securities reflect ownership in some sort of asset.  Where we are lacking assets is in real estate.  Here is a graph of the household real estate market values over time.  I will show it first with a log scale, then with a normal scale.  Even if we take the 50 year trend from the bottom of the market in the late 1990s, the trend would have us hitting $40 trillion in real estate by now, compared to the current level of about $25 trillion.  Just as the graph above shows that implied yields from homes in the 2000s were not markedly different from yields in the 1980s, we see here that real estate values were not particularly distant from the long term trend, compared to the 1980s.  But, there is no precedent for the drop in trend.  It was the bust what done us in, not the boom.

Reasons for this, as I have mentioned already include (1) regulatory barriers that have kept millions of housing units from being built in the major metro areas and (2) the unnecessary collapse of the money supply and mortgage credit market after 2006.  One problem is real and one is nominal.

So, we are short at least something like $15 trillion in assets in household real estate.  That's a lot of phantom buildings that could be soaking up capital.  And, these are capital outlays that would immediately begin pulling up real incomes, especially for low income households, because they would push rents down.

But, note, yields in housing aren't low.  They are nearly at the top of the long term range, even though alternative real long term securities have very low rates.  This is about lack of access.  Institutions have been buying up real estate with all-cash investments, but the single family home market was so dominated by owner-occupiers that there is a limit to the speed at which they can increase demand.  It's not a lack of trust in financial intermediaries that is stopping that investment from happening.  It's not a lack of trust in financial intermediaries that is starving our metro areas of housing.

Is it lack of trust in private label MBSs?  I doubt that DeLong is pushing for a return of these.  But, the GSE's continue to have stagnant asset levels.  Is there a lack of trust in the GSE securities?  I don't think so.

And, it is odd that DeLong says the problem this creates is:
Hence in order to reach full employment we need unrealistic assessments of real returns promised by investment in physical, intellectual, and organizational capital: we need bubbles.
So, these same savers that are too gun shy to invest in securities from financial intermediaries can be repeatedly tricked into making foolish investments with unrealistic expectations?  Are investors too frigid or too amorous?  Maybe they fluctuate between the two, and always at the wrong time?  Those irrational investors seem to be doing a lot of work holding this model together.

Source


Source
The lack of trust is a lack of trust in the regulators and the monetary authority.  The banks simultaneously have been told that they will need to take more legal responsibility for mortgages gone bad while the monetary authority continues to threaten deflationary policy.  (FOMC members have been out today pushing for a September rate hike, while 5 year inflation expectations crash to 1.3%.  You know how those irrational investors are, though.  They were pushing 5 year inflation breakevens down to 1.3% back in September 2008, too.  They're always doing stuff.)  There are plenty of households who would like to fund new housing with mortgage credit.  The average FICO score of rejected mortgages is higher now than the average FICO score of accepted mortgages was before the housing boom.  There are plenty of investors who would fund it, too.  It's the intermediaries that we have chased away.

DeLong recommends engaging in stimulus public spending in order to make up for the risk averse savers.  Given that regulatory agencies from the city to the national level have destroyed tens of trillions worth of potential assets, governments definitely have access to low-yield borrowing looking for assets to fund.  But, wouldn't it be better to fix the supply problem in the private sector?

Is the problem that investors won't fund low risk securities unless we construct a bubble, or is the problem that whenever investors fund low risk securities, our regulatory apparatus starts identifying bubbles and popping them?  What we have here is strong form Inefficient Markets.  While pundits, economists, and the man on the street all jeer "bubble" in unison, the few firms that have been able to pull together the organizational foundations to manage broad portfolios of rentable properties have been Hoovering up excess returns - returns that average households will be denied, for their own protection, of course.  Haven't you heard?  They've got short termism disease, the poor saps.

PS:  In 2005, real estate market values were about 23% above my trend line.  But, as I noted above, real estate values were probably inflated by about 40% because of accumulated excess rent inflation and expected future rent inflation.  Imagine if we had let real estate values moderate by accommodating supply instead of undermining demand.  Previous periods of moderation in real estate market values coincided with moderation in rent inflation.  Rent had only begun to moderate back down to levels similar to core inflation at the peak of the boom in 2004 and 2005.  Could it be the case that price/rent ratios were about to begin falling by 30% as rent inflation expectations fell, and what we needed was monetary accommodation to (1) encourage continued supply of new homes and (2) provide nominal cover for the real drop in home values that that supply would produce?

Which path had more downside?  The one we took, where short termism was punished in our quixotic quest to make finance behave?  Or the one we might have taken where we might have built a bunch of houses and struggled our way through a few years of 4% inflation?

I suspect that anyone reading this who believes we had a bubble fueled by short-termism will consider the idea that we should have built more houses to be farcical.  I have already pointed out that rent inflation is an odd thing to see if you have an oversupply of homes.  It should also be noted that homeowner vacancies were low until after we stopped building homes, housing inventory was low until after we stopped building homes.  Rent, which had moderated in 2004 and 2005, shot up again after we stopped building homes.  There is a lot of strange stuff to explain if this was an oversupply created by short-term speculation.

Monday, August 3, 2015

We Are the 100%

I was playing around with data today, and noticed this strong relationship.

If there is a change in the trend of stock market returns, there is usually a similar change in trend in the earnings of production workers, with an average of about a 4 month lag.  The change in equity values is much larger, because equity owners accept most of the cyclical risk in the economy.

The 1990s were a period of relatively stable changes in the rate of growth of incomes and equity values.  It was also a period of high income growth and high equity valuation growth.  Stability is valuable.  It should be our goal.  To risk instability because investors might internalize that value or because capital might occasionally capture more of that value than labor is a rather self-defeating point of view.

Further, there seem to be two undeniable facts about incomes over time.

(1) In the end, we all rise and fall together.

(2) The distribution of incomes will have a stochastic quality.  There will be times when capital benefits more, when high incomes benefit more, or when low incomes benefit more from transitory economic developments.

Given that these two factors exist, there will be many times when the best policy for one group will be to encourage outsized growth for the other two groups.

If a stance against policy is based on the idea that the Fed is backstopping the stock market or the claim that accommodative monetary policy is a "bailout", it is just as much a stance against wage earners as it is against equity owners.  This is true even if capital is currently seeing more growth than labor or high earners are doing better than low earners.  And, even if we enter a phase when low incomes capture a larger portion of secular growth, capital will appear to benefit more because of its extreme cyclical exposure.

This is not a commentary on safety net policies.  Before we consider social support policies, there is the simple point that progress is progress.  There is a shocking amount of commentary in this country right now that amounts to saying we should undermine potential growth because it's the wrong kind of growth.  Worse still, there are appeals to stagnation that come from confusion, such as misunderstanding the difference between high wage incomes and capital incomes.

The 1990s was a very prosperous time for households with lower incomes.  It also happened to be a time when income variance grew and capital income was high.  Given the state of technology and the state of the developing world, that is probably what success looks like today - for everyone.

The longstanding challenge of human civilization has been the struggle to overcome our unfortunate tendency to destroy absolute prosperity through battles over relative status.

HTCH Bleg

I've been long on Hutchinson Technology for a while.  Coincident with their recent quarterly report, they released news about improvements in their new product for Optimal Image Stabilization in smartphone cameras.  So, while investors remain in limbo with the turnaround that seems always to be 6 months away, this seems like a potentially transformative development.

Are there any readers with a foot in the smartphone business?  What is the unit sales potential of this in the near term?

Hutchinson is definitely a poster child for one of my speculating rules of thumb - that putting yourself in a position where you might be roundly embarrassed by your public positions can be very profitable.  I may not have mentioned this before, but that is also a very effective, and demeaning, way to bankrupt yourself.  Therein lies the rub.

Anyway, come on readers....Do you know?  Or, do you know someone who might have an informed opinion?

Friday, July 31, 2015

Housing Tax Policy, A Series: Part 50 - The housing market is efficient.

I have sometimes used 30 year mortgage rates as a proxy for expected returns on homes.  I have previously justified this from a bottom-up, required rate of return, point of view.  They are both securities with very long durations and exposure to the same type of asset.  But, I wonder if a market arbitrage justification is stronger.  If expected returns from home ownership are higher than mortgage rates, then home buyers would leverage up on mortgage debt and bid the price of houses up until those rates of return equalize, and vice versa.  In fact, everyone basically agrees that this is what happened in the 2000s.  Most people seem to think that it is because (1) home buyers had false hopes for expected returns in their homes and (2) mortgage rates were held low by the Fed.  I don't disagree with this, except that (1) those hopes have been justified by continued supply constrictions and rent inflations and (2) long term real rates were low, in part, because of tight monetary policy, not loose policy.

I think the data bears this out - housing keeps pretty efficiently to no arbitrage pricing.  But, before I get to the data, I just want to note that this shouldn't be controversial.  Even though it is usually put in terms of homebuyer demand ("We get a housing bubble when mortgage rates are low and homebuyers expect prices to go up."), this is basically saying the same thing ("Expected home returns will converge with mortgage rates.")

I like to start with the BEA and Fed Flow of Funds data.  From the Fed, we can get the market value of owner-occupied housing and outstanding mortgages.  From the BEA (table 7.12) we get owner-occupier housing expenditures, including an estimate of depreciation.  One of those expenses is net interest, which, divided by outstanding mortgages gives us an aggregate estimate of mortgage interest rates.  The BEA also gives us net rental income after all expenses and depreciation.  Rental income plus net interest expense, divided by total home market values, gives us the aggregate total return to home ownership.

Here is a graph of those measures.  Mortgages are a nominal security, but housing returns are real.  In other words, future mortgage payments are fixed, but net rent to the homeowner will rise with inflation.  So, expected inflation is embedded in the mortgage interest payment while the mortgage principal remains fixed, but for the homeowner, rent and the property value inflate over time.  So, expected inflation is the difference between the interest rate on mortgages and the return to the homeowner.

I like using these measures, but we quickly run into problems.  First, most mortgages have a fixed rate, so the interest rate here is somewhat backward looking.  But, even solving this problem would not solve all of our inflation issues.  There is a difference between expected inflation premiums and experienced inflation.  Since a mortgage is nominal and a home is real, owning a leveraged home is taking a long position on inflation.  So, during periods of unusual inflation fluctuations, the real returns on homes remain fairly level, but the gains and losses on their short mortgage position are substantial.  This makes measuring the reliability of no arbitrage pricing difficult.  It would be nice if I had a long historical data set of real long term bond rates.


Source : accuracy of real rate, from most to least is: green, red, purple.
In the Fred graph from the earlier posts on this topic, we can see a pretty reliable parallel between home yields and real 30 year treasuries from 1990 to 2006.  The data above go back to 1950, but the 1970s and 1980s are a little tricky, because it is hard to separate out actual inflation, expected inflation at different durations, and inflation uncertainty.

Here is a graph that compares the 30 year mortgage rate to my measure of housing yields to arrive at an alternate measure of inflation premiums.


The blue line is the inflation premium implied by the effective
aggregate interest rate paid by homeowners.
Now, if we compare all of these measures to smoothed 5 year CPI inflation and CPI Shelter inflation, we see that the inflation premium derived from the 30 year mortgage matches actual inflation pretty well.  But, during the times when inflation is stable (roughly 1955-1965 and 1990-2015), all measures move together pretty well.  (I'll address 2002-2015 with more detail later.)

This may not seem like a big deal.  These are, admittedly rough measures, so the error bands implied by my visualizations are pretty broad compared to the ranges of each variable.  But, it is important to also consider the counterfactual.  One thing I think we can say here with confidence is that the idea that home buyers are not operating within typical models of financial tradeoffs and that home prices can be pulled into the stratosphere by naïve and hopeful buyers is not remotely supported by the data.

One way to think of the inflation premium measures in these graphs is that they represent the level of inflation that completely leveraged homeowners would need to experience in order to avoid capital gains or losses on the real value of their mortgage principal.  Or, put another way, if mortgage rates and home yields are, indeed, arbitraged through efficient markets, this inflation premium represents the inflation that the marginal homebuyer expects to see.  So, if home prices were being bid up to unreasonable levels because of over-optimistic speculators, we would see that inflation premium rise.

Some critics of the housing boom reference survey data where homebuyers appear to have very optimistic expectations about future home values.  But, what we can see here is that these expectations did not factor in the home prices.  Home prices during the boom did not depend on excess rent inflation for their valuations.  Implied inflation was 2% to 3% during the boom.  The counterfactual that seems to be widely believed is that the inflation expectations that buyers used to justify home prices during the boom was as much as 10% or more.  There is no evidence for that at all.

To look at this a little more closely, here is a graph of the difference between the spot rate of 30 year mortgages and the effective aggregate rate paid by homeowners.  The effective rate tends to be more stable and the spot rate is more cyclical.  In the 1970s we can see the spot rate climb as inflation spiked, while many homeowners retained their existing mortgages with lower rates.  We don't tend to see this separation when rates are decreasing because owners can refinance at lower rates.  In the inflation graph above, we can see that the inflation premium implied from the BEA data actually declined in the 2000s.  In other words, home prices became especially conservative during that period.  Home prices were justified, even if rent inflation began to subside.

Looking back at this graph of mortgage rates, the effective rate dipped during this time.  So, it could be that effective rates were declining because of teaser rates, ARMs, and generally shorter durations.  If we adjust for that, the effective rate might be closer to the running inflation rate, but it clearly was not above it.


Source
On the other hand, the inflation premium implied by the spot 30 year mortgage rate did bump up during the boom.  It's a little more noisy than the effective rate, but the noise does point to a higher required inflation rate during the boom.  However, if we look at mortgage spreads between mortgage rates and treasuries, we see an increase in the spread.  This can be easily missed, because, from a mortgage investor point of view, rate spreads with 10 year treasuries may be more common.  This is because prepayments lower the effective duration of a basket of mortgages.  But, from the perspective of home value arbitrage, the duration of a 30 year mortgage is more similar to a 20 year treasury bond.  What we see is that the spread between mortgages and 10 year treasuries was fairly stable in the 2000s, but after 2003, the spread between mortgage rates and 20 year treasuries jumped by more than a half point.

So, the higher required inflation implied by 30 year mortgage spot rates signals conservative bankers as much as it signals optimistic home buyers.  The trend toward shorter duration and floating rate mortgages after 2003, as with so many pieces of evidence here, can fit in both a "bubble" story and a  reasonable efficiency/arbitrage story.

In either case, homebuyer expectations were within the range of trend inflation.

This inflation premium gives us another way to look at the notion that if we didn't have artificial barriers to homebuilding, shelter inflation would converge with core or broad consumer inflation over time.  This is because mortgage investors would arbitrage mortgage rates with other bonds.  Rent inflation would have little relevance to them, in terms of interest rates.  Compared to the rate on real bonds, mortgage investors would require an inflation premium reflecting broader incomes and consumption.

But for homebuyers, the inflation premium that would be important would be rent inflation.  It would be changing rent inflation that would change the income of their investment from their original expectations.

In an unencumbered market, if shelter inflation and broad inflation deviated, home supply would expand until they converged.  If shelter inflation was high, home buyers would be enticed to buy homes on leverage, funding new building, which would pull down rents until the inflation rates converged.  In addition to an arbitrage between nominal and real returns on investments, there would be a natural arbitrage between rent inflation and broader inflation.

But, since large segments of the real estate market in many large cities are incapable of market-based supply responses, this arbitrage has been playing out through price much more than through quantity.  The rising prices are a measure of this inefficiency.  If housing supply markets were efficient, it would take very small price adjustments to create supply reactions.  The end result of rising rents would be new building that led to subsequently falling rents.  But, since some large markets have housing supply that is very inelastic, home prices must rise until real yields on homes fall enough to bridge the gap between the two inflation premiums.  This also means that when there are sharp supply constraints, in a market with efficient demand homebuyers will rationally be led to take on higher leverage, because the supply constraint will provide persistent arbitrage profits.  Could the rise in mortgage spreads after 2003 reflect caution from the banks?  Perceived risk resulting from the moderation of rent inflation that happened briefly while home building was at its peak, which led mortgage rates to rise, so that banks were claiming some of the profits available from the inflation arbitrage?

A point of distinction to think about here is the difference between rent inflation and home price inflation.  The surveys of the optimistic homebuyers tend to relate to home prices.  Housing rents tend to be much more stable.  But home prices are based on a complex, very long duration security.  In a housing market that has reasonable valuations, as we see in the measures above, homeowners could reasonably expect double digit price increases for several years if local rent inflation is not expected to abate.  This sort of price behavior is not unprecedented, and we should expect it to be especially possible in today's environment where metro area supply constraints are especially bad, and naturally low real interest rates make intrinsic values especially volatile.

Real yields on homes were just over 2% at the top of the boom, and were in line with long term real treasuries.  Rent inflation had been running at about 3% compared to broad inflation at closer to 2%.  Home values become undefinable - infinite - if those inflation levels sustainably diverge by 2 1/2%, matching the real yield.  Now, there may be reasons why that wouldn't happen, but there is a lot of space between a few years of 10% price gains and infinity.

As for the period since 2007, arbitrage has failed.  Homeowners now don't require any rent inflation to justify home prices.  Any rent inflation is an excess gain for them.  And rent inflation is now running at 3%.

Thursday, July 30, 2015

Housing Tax Policy, A Series: Part 49 - In search of the marginal homebuyer

Before I go into the next post about long term no-arbitrage pricing for homes, I want to address the notion of a home as a security.

First, I realize that as individual assets, homes have an extremely localized exposure.  Because of the way we own homes, we regard them in this framework, and that works for the purposes of individual wealth management decisions.  But, this is really no different than corporate equity.  Firms also can have high idiosyncratic behaviors.  And, in fact, just as households and home ownership decisions, most work done by financial analysts is concerned with these idiosyncrasies.  So, the localized nature of homes does not particularly set them apart from other asset classes.

There is something interesting to think about here, regarding modern portfolio theory and the effects of diversification.  Theoretically, the ability to diversify away idiosyncratic risk creates a marketplace of securities with returns that, in the aggregate, reflect only the systemic risks of the asset class itself.  We tend to think about the ability to actually hold a good facsimile of the market basket of securities as the process through which this takes place.  But, an individual investor can accomplish most of the available risk reduction of diversification with only a handful of securities.  And, in the end, the arbitrage of prices to reflect systemic and idiosyncratic risks really comes from a more diffuse and complex set of trades and allocation decisions that don't necessarily rely on any single investor to be fully diversified.

In fact, it appears to me that this process can take place with a seemingly thin network of potential trades.  It is hard for us to conceive of the millions of allocation decisions and how each decision creates a network of 1st and 2nd order effects on its potential substitutes.

Thinking about these things in housing is always complicated by the coincidental nature of housing consumption and home ownership when most households supply their own demand.  It is important to keep these actions separate for useful analysis, and I find that they almost never are.  So, we might think of decisions about moving between cities, population flows, etc. as part of this process, but those changes are changes in housing consumption.  They are priors in the market for home ownership.  Markets for home ownership are pretty efficient, so, given these priors, just a small set of transactions on the margin pushes prices to account for fundamentals.  More often than not, these marginal transactions probably involve landlords who must treat the transaction mathematically.

So, what I find is that returns to home ownership are actually bid down to a return level that reflects few returns, on net, to idiosyncratic risk and reasonable returns on risk adjusted investment.  Homes, in the aggregate, have very stable incomes - similar to the income on inflation-protected bonds - and rather than having default risk they have liquidity risks and occasional vacancy risk (which is nearly eliminated for an owner-occupier).  And, the return level we see for homes over time reflects this - returns are very similar to inflation protected treasuries.  Actually, I find it useful to treat mortgage rates as a proxy for home returns (in nominal terms, with inflation included), and we know that mortgage rates tend to have a relatively small spread of about 1% above long term treasuries.

I hear pushback regarding this idea from financial advisors.  They tend to separate home ownership from other portfolio management decisions.  People buy homes because of the benefits of owning, not because they offer high ROI, they tell me.  It's consumption, not investment.  I realize that there are benefits to ownership and that families don't tend to think of their decision to buy homes as portfolio management.  That is because homes aren't commodified like bonds, so as individuals, our focus is on the factors that differentiate one house from another.  Very few of us are the marginal buyer, and it is the marginal buyer that pushes homes to non-arbitrage prices.

We tend to live a renting lifestyle where the high transaction costs of housing make it a non-starter until we step over some threshold in our life cycle that puts us in the homeowner category.  These things tend to happen in regime shifts, so we tend to hop right over the marginal buyer.  This gives us the impression that the marginal buyer doesn't exist.  But, that's a false impression.  There are some portion of owner-occupiers who are at the margin, and landlords and homebuilders are basically always there.

One other piece of confusion that I want to avoid, which I have mentioned before is the idea of thinking of home values as leveraged purchases made possible with mortgages.  This, along with the idea that most households are not on the margin, and would be willing to bid home prices up if they needed to, feeds the idea of a housing market given to irrational booms when credit is loose.  But, many households have very high levels of equity.  Housing generally lacks price discrimination, so it seems to me that it would be difficult to argue that prices respond to buyers with excessive consumer surplus.  The forces at the margin of supply and demand set the prices.

So, I tend to analyze home values from a total equity point of view.  Pulling in mortgage factors just confuses the matter.  Homes have intrinsic values, regardless of their funding.  Now, I confuse this by using mortgage rates as a proxy for required returns on homes.  But, I am treating mortgages as another form of real estate ownership with a similar level of required yield, not as a source of funding or demand for the buyer.

This might all seem theoretical, but it is confirmed by the empirical data.  Home prices over time follow the path you would expect them to follow if they were a part of an efficient market with relatively low systemic risks.  I will look at the data, which I think will include some contrarian findings that I might have called surprising about 40 posts ago.

Wednesday, July 29, 2015

Housing Tax Policy, A Series: Part 48 - Accommodative Appraisers are not evidence of a bubble

Appraisers are a governor on price fluctuations.  They are a source of friction.  They can't increase price fluctuations.  Nobody with a winning bid on a home raises their bid because the appraisal came in higher.  Appraisals are part of what makes home prices sticky.

We don't have banana appraisers in grocery stores, yet banana prices don't just keep skyrocketing upward because of their absence.

Appraisers have been widely blamed for fanning the flames of the housing boom, but even if you don't buy my argument above, accommodative appraisers are not evidence for a bubble.  There are two scenarios that could explain the speculative boom.

1) Buyers started bidding up the prices of homes with little concern for their value, accommodated by banks issuing mortgages without regard for the danger of these prices falling back down to reasonable levels.  Since the houses were overpriced, banks had to find friendly appraisers who would use aggressive methods to justify the prices that kept the bubble going.

2) Home values were rising at an unusual rate, due to rising rents, rising expected rents, and falling long term real interest rates.  Because of the unusual rise in intrinsic values, frictions in the home market made it difficult for market prices to follow.  This created an opportunity for "flippers" and speculators who could profit from the price stickiness by buying homes at less than intrinsic value and selling them fairly quickly at an expected profit once the market price overcame those market frictions.  Appraisers willing to use more aggressive methods helped to disengage the housing market from those frictions and reduced the inefficiencies that led to speculative profit taking.

Maybe scenario one seems overwhelmingly more reasonable to you.  That's fine.  The point is, aggressive appraisers will appear in both scenarios.  They are a sign of strongly rising home prices.  If prices are rising quickly, appraisers will face these dilemmas.  Strongly rising prices are not a disputed fact.  The fact I dispute is that prices were unhinged from fundamental value.  Wherever we come down on that, the behavior of appraisers is irrelevant and is not a sign of a bubble.

Here is a graph from yesterday's post, comparing this measure of housing "yield" to 30 year real treasury yields.  These measures of relative yields did not diverge during the boom.  They diverged during the bust.

My next post will probably be a new review of historical home values and returns.  On the issue of home values, here is a comparison of 20 year TIPS (inflation protected) bonds and homes from the end of 2006 (the worst time to buy a home) to the end of 2014.  For home returns, I am using BEA data from Table 7.12, estimating net rental income after all expenses and depreciation (rental income plus net interest expense), and total real estate market values from the Federal Reserve's Flow of Funds report.  Housing Yield is that net income estimate divided by owner occupied home market values.

Yields at the end of 2006 were very similar for both homes and 20 year tips bonds.  CPI inflation and Shelter inflation were both about 2% in the intervening 8 years, so the experienced income inflation for both of these investments has been similar.  But, total returns were 1.8% for homes and 5.4% for 20 year TIPS over those 8 years.  Yes, that's right, the total return to the average home bought at the worst possible time - the end of 2006 - has been a positive 1.8%.

Total returns on the average home were undermined by the jump in yield (which moves inversely to price).  So, today, the average home yields 3.4% and TIPS bonds yield 0.7%.  Keep in mind that shelter inflation at this point is running a full point above broader inflation rates, so in addition to earning 2.7% higher real returns, homes are also pocketing an extra 1% of inflation growth each year now.

As I have pointed out, if there was a housing supply bubble, the adjustment would have been associated with dropping rent income.  We have not seen that at all.  The bust has been entirely from an increase in yields on homes.  This is a sign of a negative demand shock in home ownership.  It is important to distinguish between home ownership and housing consumption.  These are two different issues, and it seems like pundits frequently treat buying a home as if that is the same as adding a housing consumer.  It's not.  If anything, it may be adding a housing supplier.  Sometimes, observers do treat the boom as an overbuilding phenomenon, but the intervening years have not borne this idea out, since rent continues to rise.

I suppose one reaction is to say that monetary policy has been loose all this time and the 0.7% 20 year TIPS yield is artificially low.  First, there is simply no way that the Fed could push 20 year TIPS yields to 3.4% by tightening the money supply.  Second, if they could somehow do that without creating a deflationary mess, then TIPS returns in the table above would basically match the average home return.  So, over an 8 year period, TIPS bonds and homes would both have exhibited normal behavior in the face of rising real yields - reasonable incomes with small aggregate real capital losses due to the effect of the new yield.  So, even the mistaken identification of low long term rate rates and recent Fed policy as loose doesn't salvage the housing bubble story.

We simply have created a period of time where home buyers have been able to capture above-market yields because of regulatory and monetary obstacles to home buying.  With a decade long economic dislocation as the side effect.  I should have more on this tomorrow.