Thursday, September 4, 2014

Speculative Position in Housing

I have written many posts regarding my bullish position on home prices.  This early post on the topic probably gives a decent overview of my narrative.  So, I won't recap my thesis here.  My starting point here is simply that home prices in the 2000's were not as excessive as is widely imagined.  Low real and nominal interest rates led to a boom in nominal home prices and that led to excesses with regard to low down payments, subprime mortgages, bank speculation, etc. (not the other way around). Prices might have moved into an unjustifiable range toward the very end of the episode, but for the most part, price stickiness in real estate was preventing markets from clearing efficiently.  The large amount of speculation going on at the time was a product of sticky prices that were slow in catching up to intrinsic values.  (This is where we should expect to see speculators.  Part of what creates a false narrative about the housing market in the 2000's is the perverse colloquial belief that speculators are largely engaged in pushing prices away from intrinsic values, as opposed to collectively making markets more efficient.  People who understand markets tend to understand this common error explicitly, but the power of our aesthetic sensibilities on these matters is such that the error seems to sneak into common interpretations of events like this by informing priors without ever being stated explicitly.)

Here is a graph of Home Prices relative to Rents and Mortgage Rates.  I have discussed in my previous posts how most of the rise in prices could be justified by the low long term interest rate environment.  Average New Home prices and the Case-Shiller 10 City Index have markedly different behavior in the 2000's.  Please comment with any insights that you have about this or links to discussions.  I'm not sure that I completely understand the causes for these differences.  In either case, I am not that interested here in arguing for a specific value.  Only in pointing out that home prices have a lot of room to move up rationally.  Long term interest rates could rise nearly 2 points without moving above the low rate environment that was in place in the 2000s.

Here is a graph comparing relative mortgage payments to rent.  (A caveat: over very long time periods, differences in the underlying adjustments of these data series may cause some divergence.)  Mortgage payments are extremely low compared to past relative levels.  Keep in mind that while lower inflation premiums should lead to lower mortgage payments, lower real interest rates should actually increase mortgage payments, relative to rent.  Even if mortgage rates increased back to 6%, with no change in home prices, mortgage payments would still be lower than rent, indexed to 1987.

Current Home Price Trends
Rent shows YOY change, Home Prices show MOM change
Home prices have been recovering, generally over the past couple of years.  Some of the more sensitive indicators are showing some leveling out.  Here is the Case-Shiller 10 City Price Index (both seasonally adjusted and not) and the CPI for rent.  There are some difficulties with the decline of distressed sales and its effect on seasonal adjustments.  It generally appears that home prices are settling down to single digit annual increases.  But, it should be noted that all of the post-crisis growth in home values has come from institutional and cash buyers.  Mortgages have been stagnant since early 2008.  Nominal home prices, at least according to the Case-Shiller indexes, are roughly back to where they were in early 2008.  And, the long-standing typical balance between mortgages and equity values has roughly been re-established.

This is where QE3 was so important.  Its effects on bank credit, inflation, and real economic growth may have been muted, but, since the 4th quarter of 2012, household real estate market values have increased by about $3 trillion, and this was likely goosed by the added liquidity.  This greatly reduced household real estate leverage.  Without this boost, household credit markets would be dead in the water.  But, QE3 basically carried us back to a place where household real estate markets might be able to achieve sustainable growth without further infusions of cash.

Now that housing has recovered from the demand/deleveraging crisis, we should see a sort of self-healing circle as mortgage and equity grow together, which will allow traditional home owners to bid prices up to their reasonable levels.  To the extent that home prices have slowed their re-ascent, I think this is a temporary lull as mortgage growth kicks into gear.  It would be quite normal for mortgages and total real estate market values to enter a period where both are growing by about 1% per month.  Some of this will play out as new home production and some will play out as price appreciation.

I need to clean up my data a little bit on the homebuilder revenues,
but this is pretty close to the consolidated outcome of the public firms.
For the purposes of a position in homebuilders, I'm not sure that it matters that much what the divide is between price appreciation and new home construction.  Total home equity and total market value of household real estate seem to correlate fairly well with revenue growth among the home builders.  So, for the purposes of this proposal, I am going to avoid the problem of forecasting new home starts, rent inflation, and the price to rent ratio.  These factors will settle into an equilibrium reflecting the factors I have touched on before.  I am going to rely simply on the historical tendency for total household real estate market values to grow in the range of 10% to 15% per year during periods of expansion, and I will use this value to forecast home builder revenues.  This range probably isn't accidental.  This probably reflects the limited ability of the housing market to reach new value levels because of issues like production bottlenecks and sticky prices.  I am convinced by my previous housing analysis that the price pressures on homes are strong enough to continue to push market value growth to that level.

I had originally tried to conceptualize the home builders in our current volatile context as a sort of stable building operation sitting on top of a big pile of real estate assets, so that, in this context, they would effectively be land speculators, even if they don't tend to operate or view themselves as such.  But, I could not find any systematic way that large fluctuations in land values were moving into their bottom lines.  The fluctuations in the real estate market came to the home builders' bottom lines through higher volumes and some margin expansion.  As much sense as it makes to me to look at a firm, like Hovnanian for instance, as an incredibly leveraged option on land appreciation, for some reason that I don't understand, it seems like the bottom line really is a product of operations, and profits seem to come from revenues in a pretty straightforward way.

So, as a basic framework for looking at a position in the industry, I would start with an expectation that by 2016-2017, total homebuilder revenues will be 75% - 100% higher than they currently are (which correlates to total household real estate 30%-40% higher than the current level).  Keep in mind, while I think a 30%-40% rise home price-to-rent ratios from where we are is not outside the realm of reasonable expectations, the total increase in household real estate is a combination of rising rents, rising price-to-rent, and new home production.  So, this forecast could play out even if we just see an increase in the teens for Price-to-Rent ratios.  I would say that, given current trends, something like a 4% increase in the housing stock, a 10% increase in rent, and a 15% increase in Price-to-Rent, over a 3 year period is actually a fairly conservative forecast.  And, that would get us into a 30-40% range for total real estate values.

I think this is more optimistic than the typical forecast for homebuilder revenues.  I am basically forecasting a positive outcome fairly far out on the probability distribution represented by current market prices.  This forecast can be very specifically targeted by taking a highly leveraged position.  Looking at a firm like Hovnanian, which has very high financial leverage that in many cases is funding claims on land that are, themselves, options, and where I can take a position in out-of-the-money call options on the firm's equity - I can take a position that is leveraged to the third power, and each layer of leverage is really high leverage with insurance on the downside.  I love these sorts of positions, where I can isolate my speculative idea and expose myself to tremendous upside with very little downside.

I will follow up with a second post tomorrow.

Wednesday, September 3, 2014

Framing is everything

Joe Stiglitz recently wrote this comment in his review of Martin Wolf’s ‘The Shifts and the Shocks’ (HT: EV):
"the problem is not an excess of savings but a financial system that is more fixated on speculation than on fulfilling its societal role of intermediation between those with excess funds and those who need more money, in which scarce savings are allocated to the investments of highest social returns."

It strikes me as an example of how our paradigms create predetermined narratives.  For instance, here we see the housing boom of the 2000's categorized as financial speculation.  This has become a common framing.  Yet, if in 1998, or even in 2002, you had polled people to describe what things would look like in the year 2005 in two scenarios - (1) an economy characterized by a speculative frenzy or (2) an economy characterized by high levels of low-risk savings - would anyone have answered that a speculative economy would be characterized by a sharp increase in home equity, low leverage among non-financial corporations, and strong long-term bond and commodity markets?

What we saw was an extreme example of low-risk, high savings behavior.  So, what did we do?  We simply re-interpreted low-risk, high savings behavior as speculative.  It was easy to do.  Extreme behavior in any direction will start to seem speculative.  As the demand for low-risk savings vehicles increases, the quality of the supply of low-risk savings vehicles will decline.  How can it be any other way?

And, of course, we see victims of the supposed reckless behavior in the high numbers of minority and working class homeowners who lost their homes.  This is in contrast to those halcyon days when bankers used to behave responsibly - when in demand crises, only wealthy homeowners defaulted, I guess.  And, thus, math and the inevitable biases of scarcity become servants of our paradigms.

Now, imagine how we would describe the past decade if private intermediaries had doubled their leverage in just a few years, with little change in production?  Talk about a speculative bubble!  Joe Stiglitz would be apoplectic.  Yet, this pretty much describes public finance since 2008.

I don't want this to be taken as a comment on the appropriate level of public debt, public budget deficits, etc.  My point is simply that narratives are largely pre-determined.  Many people see the private sector as a dangerous, anarchic mess of greedy private financial predators.  Even when firms and investors "hoard" cash, they are derided as greedy predators.  I doubt that there is any economic dislocation that wouldn't reflexively be blamed on greedy corporations and speculators.  On the other hand, is there any level of public financial activity that would lead to broad characterizations of speculation?  Public debt in Japan is now roughly where private debt was at the height of their speculative boom.  Do we frame Japan now as being in a speculative boom?

I don't mean to paint this as the entire story.  There is a lot going on here, and there are many details to consider in the full narrative, to say the least.  But, as a start, I think it is important to realize that the tendency to ascribe dislocations to greedy private financial interests is deep-seated, and generally is not a product of relative empirical trends.  We are born with a biological preference for political dispensation of bounty.  The insights of Adam Smith and of Charles Darwin are both discoveries of emergent order.  Groups of skeptics for each of these pioneers tend to be mutually exclusive, which is odd, because the skepticism arises from the same biological bias - we prefer that dispensations have been arranged by our tribal head, whether god or politician (frequently as a single entity identified as both).

Tuesday, September 2, 2014

August 2014 Employment Preview

Here's a look at some of the employment stats I follow.  First are the comparisons of total unemployment with insured unemployment.  In the first graph, the last data point represents currently reported August insured unemployment and a projected August unemployment rate of 5.84%.  This might seem a bit optimistic.  I do think we are due for a downtick, and a rate under 6% is quite possible.  This is the number shown by the basic regression shown in the next graph.  Mainly, I used that number in the first graph to give a visual picture of the possible range of outcomes.  As you can see, it wouldn't be outside the basic trend range.  On the other hand, it is also possible for this relationship to bounce around for a few months, so that another month at 6.2% wouldn't be out of line.  The fact that insured unemployment has leveled out this month mitigates against the case for a gap down in total unemployment.  But, 6.3-5.7% is probably the 2 standard deviation range this month.

Taking a look at flows, I think we have a mixture of new cyclical trends and some statistical noise.  The readings this month will depend on how much we are seeing of each.  Net flows from NtoU have been low over the past year.  The increased rate of decline in unemployment over the past year has been roughly divided between a decline in net NtoU flows and an increase in net UtoE flows.  This is visible in the slopes of the trendlines.  As the recovery matures, net NtoU will probably settle in at about 0.1% per month and net UtoE will settle in at about 0.15% per month.

While net NtoU has declined, net NtoE has improved.  Essentially, workers who were out of the labor force are now more likely to re-enter the labor force with a job.  This is a very strong sign.  This flow has never had a positive moving average during the 25 years of data that we have, so the recent trend has been very strong.  I wouldn't expect this flow to have a sustained level above -0.05%, and that would be the sign of a very strong labor market.  This flow doesn't really affect unemployment directly, but it does indirectly.  Normally, this late in a recovery, the number of unemployed workers would be at full employment levels, so we would see a decline in the net UtoE flow and a strong economy would be pulling the net NtoE flow up as marginal or opportunistic workers enter the labor force.  In this economy, the countervailing flow may be a reduction in net NtoU instead of a reduction in net UtoE.  The level of unemployment as we end the year will reflect this unknown.  I suspect that we will continue to see strong net UtoE flows because of the continuation of re-employment patterns we have been seeing in the unemployment duration data, the positive unemployment insurance trends we have been seeing, and the continuing improvement in JOLTS data (hiring, job openings, and quits).

thousands per month (slope)
I think there is a decent chance that we'll see a downswing in the unemployment rate this month as we walk back some statistical noise from last month.  The flows to E (both UtoE and NtoE) have been subdued the past couple of months, which seems unlikely, given the strong indications of hiring we have seen from the JOLTS data and the Establishment Survey.  I think it is likely that, given the see-saw pattern of the flows data, both of these flows will see-saw up this month.

Also, the EtoU flow has remained fairly flat for the past couple of years, despite significant declines in insured unemployment rates and initial claims.  Previously, when unemployment claims were at current levels, this flow tended to be about 0.1% lower.

And, we can see in the durations data that last month's unemployment seems to have come in high, as 3 of the categories were up with no apparent cause.

My gap down didn't happen last month, but I'm sticking with my story.  I think there is a good chance of seeing a move down to 5.8%-5.9% in the reported unemployment rate for August.  As the employment market settles into more stable late-recovery patterns and the cohorts of unemployed that are being re-employed more quickly continue to move out further into the long-duration category, we will see the unemployment rate drop 0.2-0.3% over the remaining 4 months of 2014, leaving us at 5.5% to 5.7% in December.  I believe my forecast from earlier in the year remains accurate, and that we could see most of that gap taken out in August.

Monday, September 1, 2014

Minimum Wage Levels, by state

Political Calculations has a great post with some interactive maps that allow you to compare minimum wage levels and cost of living among the 50 states.

This map is interactive at Political Calculations
I have been a little worried, because it seems as though a decent number of states are starting to increase minimum wages above the Federal level.  As Political Calculations has pointed out, they were starting to do that about 15 years ago, before the national level caught up with most of them in 2007-2009.

But, looking at his recent post, it seems that most of the increases are in states with higher costs of living.  A comparison of minimum wage employment as a proportion of the labor force suggests that at levels below about 28% of the average wage, at the national level, the legal minimum wage mostly appears to stop being a binding constraint.  We are probably nearing that level now at the national level.  So, if states with high average wages raise their legal minimum wage levels moderately, it may not create a significant amount of labor dislocation.

As shown in this map, many of the high-wage/high-cost states have relatively low minimum wage levels, when adjusted for cost of living.  Washington and Oregon are the only states with grossly inflated minimum wage levels, adjusted for cost.

This might signal a build up to an eventual national hike in the next few years.  And, if that does happen, the effect of the minimum wage on employment might be similar to past experience, even with a few states already above the new minimums, because it would be having an effect in the states where it is the most binding.

Friday, August 29, 2014

Long Term Non-employment

The Financial Times has an interesting article on long term unemployment.  It is a review of this presentation at Jackson Hole by Jae Song and Till von Wachter.

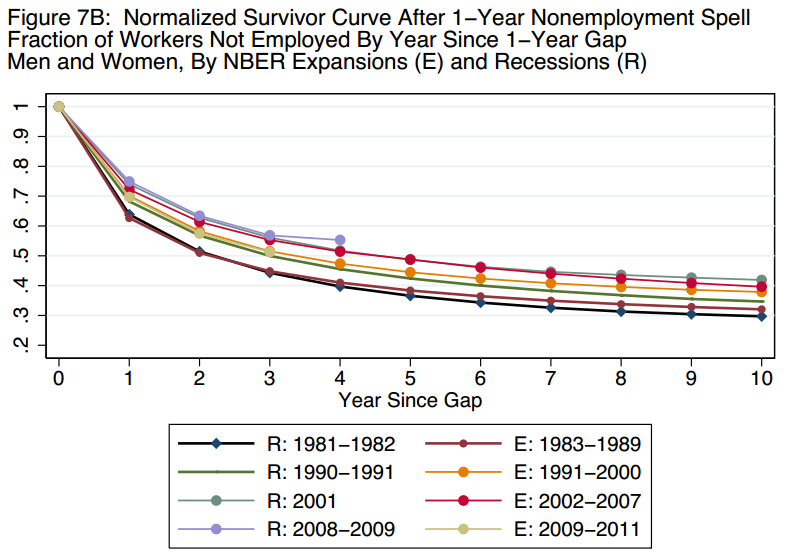
They utilize longitudinal microdata to track the employment status of displaced workers over time.  Using "non-employment" in lieu of "unemployment", they find little difference between the re-employment behavior of workers in the recent recession and workers of previous recessions.  Here is a graph of very long term non-employment persistence from the paper.  While there has been some change in the trend over time, there is little difference between recessionary times and expansionary times.  Also, there is little difference between the outcomes since 2008 and previous periods.  This is a fairly shocking finding, considering the well-known existence in the BLS's Household Survey of a large quantity of very-long-term unemployed workers.

Here is a graph of unemployment duration by age.  Keep in mind that short term unemployment durations are pretty normal now, so all of this extra average duration is coming from 1/6 of the pool of unemployed workers.  So, estimating from BLS data, it looks like about 5.2% of the labor force is unemployed in a fairly normal labor market, with average unemployment durations of less than 20 weeks.  Then, there is another 1% of the labor force that is unemployed, with an average unemployment duration of more than 120 weeks.

At first glance, these data are telling two different stories.  Here are some more graphs from the article.  First, this graph shows the fraction of the labor force that has been non-employed for one year, two years, etc.  This shows that extended unemployment was slightly worse in the 2008 recession than it had been in 1980, but not excessively worse.

The next graph (Figure 12A from the paper) shows the re-employment behavior of displaced workers in four recessions.  The recovery to employment in the 2008 recession has followed a pattern similar to previous recessions.  It is worth noting that a displacement episode appears to lead to a permanent 10% reduction in employment among the affected workers.

Finally, in the Figure 6A from the paper, we can see the surprising finding that the level of long-term nonemployment has been unusually low in the 2009-2011 period.

This suggests that much of the very long term unemployment in the current count is mostly a categorization issue related to workers whose behavior hasn't been materially different from previous recessions, but who may have been more likely to refer to themselves as unemployed in surveys because of subtle framing effects related to public labor policies, such as emergency unemployment insurance (EUI).  If that is the case, it would suggest several implications:

1) Unemployment has been overstated, relative to previous recessions.  This would apply to the approximately 1% of the labor force that currently is categorized as unemployed with very long unemployment durations.  It would also apply to the U-6 unemployment rate that includes marginally attached and part time workers.  The paper outlines how there tends to be marginal employment activity over time with long term non-employed workers, after a displacement, but that over time permanently non-employed workers become a larger proportion of the remaining non-employed.  Following this pattern, we should continue to see a reduction in U-6 unemployment.  I suppose that we might end up with a permanently self-identified population of unemployed workers, but I think it is more likely that to the extent that this group reflects the displaced workers who permanently leave the labor force, they will slowly begin to self-identify as not-in-the-labor-force.

So, if this is the case, the current unemployment rate, stated comparably to previous periods, might be in the low 5%s.  This would explain how real wages have been higher than we should have expected, given the unemployment rate.  The authors also point out that the permanently non-employed displaced workers tend to be older, which also might explain why unemployment in this recession tended to be excessively high for older age groups.

Here is a graph of employment flows.  Note that the most unusual movement in the recent recession was the unusual increase in flows between unemployment and "Not in Labor Force".  Flows between Employment and "Not in Labor Force" and between Employment and Unemployment reached levels slightly worse than the 2000 recession and about the same as the labor market in 1995 when these data series begin.  And, these sets of flows are currently back at normal recovery levels.  This would lead one to expect a business cycle where unemployment topped out in the high single digits and is back around 5%.  The outlier here is the flows between unemployed and "Not in Labor Force", which moved much higher, relative to the other flow sets, and which remain elevated.  Could this unusual movement reflect a change in self-identification and categorization among marginally attached workers who, in previous downturns, simply identified as "Not in Labor Force"?

This also comports with the recent high level of job openings and the idea that, adjusted for demographics, JOLTS indicators point to a historically comparable unemployment rate around 5.7 (which, given our current demographics would come in at around 5.3%).

2) I have been too hard on EUI.  If this paper is on to something, then EUI didn't change labor behavior significantly, so it shouldn't be blamed for the long-term unemployment problem or for significant hysteresis in the labor market.  These are workers who are mostly just being labeled differently within a fairly typical labor market behavior.  I would still argue that it might not be the most efficient redistribution program, but this paper seems to support the argument that the apparent increase in unemployment durations from EUI comes mostly from movement between "Not in Labor Force" and Unemployment, not from delays in re-employment.

To the extent that this data is informative, it might suggest that in the next downturn, an extremely generous EUI program won't necessarily be that damaging to the labor market - it will just appear to be.

These implications would all generally point to a more optimistic picture of the current economic context.  It would mean that historically comparable Labor Force Participation took a deeper cyclical dive than the reported numbers suggest.  Although, the adjusted statistic would show a dip earlier in the recession, with stronger recovery since then.  But, it also means that we are currently basically recovered and that the labor recovery was stronger and sooner than we thought it was.  Much of the remaining reductions in unemployment would typically be recorded as re-entries into the labor force.

Finally, these findings show how beneficial functional NGDP targeting could be.  There is something to be said for the creative destruction that might come out of a difficult economic period.  But, I think it's incorrect to argue for unnecessary economic disruptions.  The aggregate costs surely outweigh the benefits.  This paper points to significant permanent disemployment coming from economic dislocations.  If some of these labor disruptions are a result of suboptimal monetary policy, and if more stable nominal demand could prevent some of these dislocations, it could lead to higher labor force participation and utilization over time.  I don't think higher labor force participation should be considered a goal, a priori.  But, the permanent disemployment from these dislocations are almost certainly inefficient and are not remotely optimal for the affected workers, so in this case, it would represent improvement.


Wednesday, August 27, 2014

Squaring the Circular Logic of the Interest Rate-Leverage Connection (Updated)

I have outlined theoretically and empirically how the equilibrium level of corporate leverage, counter-intuitively, could rise when interest rates rise.  Here is a graph of corporate debt and equity values over the past half century (adjusted for inflation), with interest rates and equity premiums.

The next graph compares corporate equity and debt levels as a proportion of operating profits to nominal 10 year interest rates.

Now, regardless of any problems with this theory, it is clear that there is very little connection between relative debt growth rates and interest rates, and there is no evidence of firms significantly leveraging up on debt when rates are low (either real or nominal rates, short or long rates).  Except for recent periods of cyclical disequilibrium, debt levels have remained at a relatively stable proportion of operating profits over a long period of time.

In fact, due to the relative stability of debt levels, I have pointed out that the changing leverage comes about mostly through changing equity values.  So, generally when stock market levels are high and PE ratios are high, this is not a product of frothy markets fed by debt-accumulating corporations.

I recently was looking at Robert Shiller's CAPE ratio, and noted that its fluctuations follow a very similar pattern to the inverse level of interest rates and the inverse level of leverage.  In other words, when CAPE is high, leverage (Debt to Enterprise Value) tends to be low and interest rates tend to be low.  But, you might notice some circular logic here.  Enterprise value is a product of price.  Since debt levels are fairly stable, the change in leverage comes mostly from a change in enterprise value, which is mostly going to come from a change in share price.

So, how do we know that this isn't just an accounting identity?  To start, as I mentioned above, debt doesn't have to be stable.  In fact, I think it probably bucks conventional intuition that debt levels don't rise relatively when interest rates decline.

There is a kind of a paradox here.  Because, when corporations manage their capital, which partly entails minimizing their weighted average cost of capital (WACC), they use the market value of their equity to estimate costs.  In other words, they are looking at the cost of debt and the cost of equity with the same Debt to Enterprise Value model that I am using here.  They should be targeting their debt levels based on relative market values and costs of their debt and equity.  And, empirically, the pattern of D/EV matches what we would expect to see from that model of capital management.  If so, how are all of the adjustments to aggregate capital structures being carried by changes in equity, which is mostly a product of changes in equity share price?

I think we have to think about corporate capital as having many competing constraints, and the level of debt as a multiple of NOPAT probably hints at a lot of those constraints.  Here is the standard cost of capital formula:

If we assume away some market frictions, the cost (K) of each form of capital should reflect the same set of risks, so that, theoretically, except for the tax consequence, a firm should be indifferent about the capital mix.  This is the Modigliani-Miller theorem.  But, I think what we see in the graph above is that, in actual capital markets, in the aggregate, the cost of debt starts to accelerate when debt gets above 5 or 6 times net operating profits after tax (NOPAT).  If these constraints are in play, then, even if a firm is managing capital with the WACC model in the current tax context, with dynamic capital costs, then the absolute level of debt compared to output will tend to settle in a tight range regardless of more general risk premiums.  These other constraints, which affect K(d) as leverage increases compared to NOPAT, will make EV/D ~ PE look like an accounting identity.

In fact, it appears that there was a slight shift upward in the mid-1980's, to a slightly higher debt/NOPAT ratio.  And, using the implied corporate interest rate from the Federal Reserve Z.1 nonfinancial corporation financial tables (interest paid / Credit Market Instruments), there appears to have been a corresponding increase in credit spreads (the black line).  This could reflect any number of changes, including what appears to be an increase in average debt maturities.  This also happens to coincide with the development of the high yield bond market.  So, there may have been a one-time shift from financial innovations that allowed firms, in the aggregate, to increase debt/NOPAT levels.  But, it appears to be associated with a steep rise in K(d).

When low rates lead to a tendency for deleveraging, firms may engage in some pure capital management - buying down bonds, issuing new shares, changing dividend or buyback policies, etc.  But, these moves have expenses that may not be justified over the long term.  When equity becomes such a large portion of enterprise value, incremental increases in operations can have a large effect on share value.  So, even though debt will tend to remain at the maximum optimum level relative to NOPAT, firms will have incentives to increase NOPAT through operations management - more efficient use of working capital, etc.  In this way, NOPAT and debt levels can grow, and the high relative equity value will mean that this operational growth will be especially multiplied in the total value of the firm.  The original NOPAT expansion will create value, and then the expansion of debt made possible by the NOPAT expansion will create additional value.

So, we should expect to see NOPAT growth during times of low interest rates and low corporate leverage.  This is what we find.  NOPAT grows when leverage is low.  (Keep in mind that leverage was especially low in the late 1990's because of excessive growth expectations, and the high points after that were times of disequilibrium during demand crises - notice that leverage peaks when NOPAT crashes.  Firms quickly deleveraged as demand recovered.  So, cyclical fluctuations have been especially high during this period, but cyclically adjusted leverage has been close to 30% throughout this time.)

I am sure there are other narratives that can be built around other hypotheses, so this information doesn't create any exclusivity for my hypothesis.  But, the data can support my hypothesis.

Interestingly, GDP hasn't followed the trend of NOPAT.  Before the 1970's, real GDP was growing quickly.  And, real GDP growth leveled off during the high rate period, though not as sharply as NOPAT, understandably.  But, instead of reaccelerating, GDP growth has continued at that lower real growth rate as interest rates have declined.  I suspect there is a combination of innumerable explanations for this, including corporate foreign profits, demographic consumption and saving patterns, and maybe even issues with the difficulty of measuring consumption value in the age of the internet.

It's a shame that this sort of subject tends to be reined in by us vs. them thinking regarding corporate profits versus other household income, because there are probably many interesting things going on here - many of them reasonable and helpful for general prosperity - that would only be visible to the curious and non-judgmental observer.

My Attempt at a Curious & Non-Judgmental Interpretation:

For the investor, the real NOPAT chart shows how there is plenty of room for more growth in corporate valuations, simply coming from recovery in NOPAT.  At this point in the cycle, equities probably still offer a decent expected return without depending on expansion of valuation multiples.  (If the expansion continues, allowing for a recovery in interest rates, equities will also benefit from corporate re-leveraging as rates increase and enterprise value expands.  This would allow more NOPAT expansion and equity growth even as some valuation multiples retract.)

Regarding GDP, I suggest that the housing "bubble" was a reasonable and predictable result of the baby boomer phenomenon.  Boomers are utilizing real estate as a chimera of consumption and savings.  Homes are storing value for future consumption.  From 1997 to the peak in 2006, $8.3 trillion was accumulated in real estate equity.  The rise of home values tends to be blamed for creating unsustainable spending.  I believe this has it backwards.  Mortgages rose less than equity did.  Homes, on net, were replacing spending, not funding it.

While this seems like a reasonable phenomenon to me, it isn't particularly efficient.  The homes are storing value for future consumption, but this is only partly through home production.  Much of the savings simply creates a temporary nominal increase, just as if a rush of savers bids up the price of bonds.  While the homes are a store of value, they don't serve as a basis for economic growth and productivity.  Saving through the foreign operations of US corporations seems like a more efficient means of consumption smoothing.  But, both are inevitable.

I don't think either of these savings vehicles are picked up particularly well as either consumption or savings, so since the mid-1990s, when the baby boomers started entering this phase, GDP has been understated.  And, there has been a real loss in potential GDP growth, due to the allocation of capital to real estate in lieu of more dynamic productive assets.  (On the other hand, there is no unironic way to complain about stagnation and low productivity on a blog.)  In effect, we have all been waiting for the productivity slowdown coming from the aging boomers.  But markets are forward looking, and to the extent that trades through time are available (as they are through real estate), economic trends will be traded and shared through time.  Markets are simply allowing for an exchange with the future, which is manifest as a seemingly premature slowdown in GDP.

(Some people argue that home prices should be factored into inflation measures.  They are dangerously wrong.  But, I will note that if we did count home appreciation as inflationary GDP growth, nominal GDP growth would have been much higher in the 2000's, with most of the increased nominal income going to middle class households.  But, such is the mania behind our current malaise, that broad nominal appreciation of the most widely held durable asset in the economy is vaguely accounted for only as a cost.  So, the colloquial story of the 2000's goes something like:  high home prices led to unsustainable consumption that created a false level of nominal GDP.  And real GDP was much lower than reported, because inflation would have been much higher if home prices were accounted for in inflation measures
.......this is mistakes on top of mistakes on top of mistakes, believed with religious fervor.  I am also frequently told, with the same conviction, that the falling labor force participation of 25-54 year olds is a sign of economic desperation.  I am also frequently told, with the same conviction, that the rising labor force participation of 55+ year olds is a sign of economic desperation.  Religious fervor is helpful to believe such things.  Likewise, as we all know, US corporations are unpatriotically moving out of the US to avoid taxes.  And, we all know, actual US corporate taxes aren't high at all.  They have so many tax breaks that their effective tax rates are much lower than the headline rate.  Both things, believed with fervor.)

Since 2006, the Fed has devastated the real estate savings that the baby boomers had accumulated.  With another 5-10% price accumulation, homes will probably be back near a healthy equity/mortgage balance, at which time, after an 8 year (wow) pause, boomers can accumulate marginal new real estate equity.

Of course, wide swaths of the American public, from all sides of the political spectrum, are explicitly calling for the disruption of both of these vehicles for deferred consumption - calling corporations with operations abroad unpatriotic and warning of the developing new housing "bubble".  Many of these outspoken critics of this phenomenon are boomers themselves, who, no doubt, in their personal financial dealings are holding large positions in real estate and multi-national corporations, specifically to prepare for their future retirements.

I've said it before.  H.L. Mencken was a Pollyanna.

PS.  It also happens that the one-time increase in female labor force participation coincided with the high leverage period.  Female LFP peaked and began to trend down along with male LFP coincidentally when leverage declined in the 1990's.  So, part of the dilemma may arise from this.  This may have caused the 1960s-1980s GDP to be unusually high, while this + the age-demographic decline in LFP caused the 1990s+ GDP to be unusually low.

Added:  I should have done this before I posted.  Here is the GDP graph, adjusted for the size of the labor force.  This has a shape much like the graph of NOPAT, except, instead of rising and falling inversely with leverage, GDP/LF rises and falls with Enterprise Value.  This is affected by the Equity Risk Premium (ERP), in addition to risk free interest rates, so GDP growth stalls and returns a little earlier in the 1960s-1980s period, because ERP declined before interest rates did.  (Note: the trend lines on the NOPAT graph were mathematically derived, but I just eyeballed these.)

Tuesday, August 26, 2014

More Non-Evidence of Part-Time Work Shift

I was thinking about labor supply and demand, and the anecdotal evidence from employers that they are shifting work to part time because of the ACA.  I haven't seen definitive evidence of a significant shift to part time work in the data for number of employees.  Here is the chart of part time employment from yesterday's post.

After an initial shock and a shift from "non-economic" to "economic" reasons, the total number of part time workers has been moving down to about 1% above the pre-recession level.  This is typical for a recession.  The size of the shift up in "economic" part time workers, and the slow subsequent decline are unusual, but these trends pre-date the ACA, so it seems inaccurate to pin much if any of the trend on the ACA.

I have posited that one underappreciated factor here is that the binding constraint here may be the supply of willing part time workers.  But, if that is the case, if employers are experiencing higher costs for full time workers, then we should see an increase in pay for part time workers, as labor supply and demand settle at a new equilibrium that accounts for the new cost structure.  If the quantity of available part time workers is relatively inelastic, maybe this adjustment would mainly play out in wages.  Employers would need to increase the wages on part time jobs to entice workers who preferred full time work to move to a suboptimal work scenario.

But, there doesn't appear to be anything here, either.  Relative weekly wages for full and part time workers have moved in lock step over the past 14 years.

So, it still seems like there is a disconnect between the survey data, anecdotal evidence, and labor data.

Monday, August 25, 2014

ACA Survey from the Philadelphia Fed

Here is a survey from the Philadelphia Fed with some interesting answers regarding the ACA (HT: Patrick Sullivan).  You can click on the links for details.  The gist of it is that the manufacturers reported that, as a result of the ACA, they have decreased the number of full time workers, increased the number of part time workers, raised prices on their products, raised contributions, premiums, and deductibles on their employee health plans, and reduced coverage.

First, a caveat.  It seems to me that the jury is still out regarding part time employment.  There is a lot of anecdotal and survey evidence of this effect, but I don't see strong evidence of it in the data.  Now, it could be that there are a number of supply and demand factors at work in the part time employment realm.  I think that as the economy recovers, the binding constraint on the total level of part time workers will be the supply of part time workers.  In the meantime, I don't see any obviously odd movements in part time employment.  I'm not sure how to square this with employers reporting that they are transitioning to part time work.  There is a lot going on there down in the weeds.

Here is the graph of part time workers, as a proportion of the labor force.  The sharp rise in part time workers for economic reasons clearly happened during the recession, pre-ACA.  Possibly the recovery could have been sharper.  But, I don't see any smoking gun here, regarding an ACA-related jump in part time employment.

The average weekly hours worked from the monthly establishment survey also doesn't seem out of line compared to long term trends.


from the BLS
This all is a reminder of the difficulty of accounting for the costs of these sorts of things.  There have been a few policies that I have harped on, such as minimum wage hikes and Extended Unemployment Insurance, with specific claims about how they harmed workers.  But, in those cases, the policies had a very pointed and direct effect on some specifically identifiable people, so we can identify some sharp empirical evidence about their effects.

But, with so many regulations, like the ACA, the effects are tough to suss out.  Any effects there might be probably just slightly bend the curve of growth of human quality of life, and the damage comes in the long term.

Most of the changes the employers point out probably are accounted for as increases in nominal GDP.  There is a lot of economic activity engaged in compliance activities.  And, for regulations like this, it comes down to how the hedonic changes in price levels are accounted for.  When you lose access to your family doctor, does the BLS account for this as a decrease in quality?  Frankly, in an industry so screwed up, I don't understand how they can begin to account for economic activity.  What is the market price for a medical procedure that is "billed" at $2,500, but settled with your insurance company for $200, with a $20 co-pay?

It seems to me that much of the added costs of the ACA, the results of this survey being good examples, will play out as inflationary.  But, on the other hand, something like secondary education isn't accounted for at all in inflation measures.  That kind of government expenditure is simply recorded as real economic activity.  (Please correct me in the comments if I'm wrong.)

So, while GDP is useful for much analysis, with government expenditures at nearly half of GDP and a growing number of mandates, it ceases to be a good measure of absolute quality of life.  Some measure of the quality of public services and mandates would be required.  I'm not aware of any measure that can remotely address that.  A problem with programs like ACA is that they muddy the usefulness of indicators like GDP.  I'm not sure they even effect growth rates coherently, except in the very long term.  Government programs certainly have a knack for growing, which will usually show up as real growth in the GDP.  The same goes for mandate-based rent-seeking.  The production of ethanol, which probably put millions of acres of US farmland to use with no net positive economic benefit, added $44 billion to GDP in 2013.  (And created nearly 400,000 jobs!)

In 2012, total US government expenditures (including transfers) amounted to $47,159 per household.  The median household US income in 2012 was $51,017.  The median US household is left with $3,000 to spend on government mandates and all private personal consumption (housing, food, transportation, etc.)  To the extent that the median household engages in any private consumption at all, it is because our progressive tax code has essentially transferred those resources from high income households to median income households.  What is the value of that $47,159 of expenditures?  Could it possibly be anywhere near the amount spent?  Does it really take essentially all of the labor of the median US household just to support public services?  How can essential public services (not including off-budget mandates) require more expense, per capita, in real dollars, than the entire pre-1960 US economy?  Some people argue that we should return to 1950's tax rates.  If it is the essential services and social support of the 1950's that they want, shouldn't they argue for a return to 1950's public budgets?

Saturday, August 23, 2014

Minimum Wages, Crime, and Unemployment

Results from longitudinal panel data regarding the effects of minimum wage hikes on people who were working at minimum wage level jobs.  Appears to lead to unemployment and crime, especially among teens.  (HT: CafeHayek):
Does crime respond to changes in the minimum wage? A growing body of empirical evidence indicates that increases in the minimum wage have a displacement effect on low-skilled workers.  Economic reasoning provides the possibility that dis-employment may cause youth to substitute from legal work to crime. However, there is also the countervailing effect of a higher wage raising the opportunity cost of crime for those who remain employed. We use the National Longitudinal Survey of Youth 1997 cohort to measure the effect of increases in the minimum wage on self-reported criminal activity and examine employment-crime substitution. Exploiting changes in state and federal minimum wage laws from 1997 to 2010, we find that workers who are affected by a change in the minimum wage are more likely to commit crime, become idle, and lose employment. Individuals experiencing a binding minimum wage change were more likely to commit crime and work only part time. Analyzing heterogeneity shows those with past criminal connections are especially likely to see decreased employment and increased crime following a policy change, suggesting that reduced employment effects dominate any wage effects. The findings have implications for policy regarding both the low-wage labor market and efforts to deter criminal activity.

Friday, August 22, 2014

Readings on Fed control and risk premiums

Eugene Fama, The Review of Asset Pricing Studies, from December 2013:
In sum, the evidence says that Fed actions with respect to its target rate have little effect on long-term interest rates, and there is substantial uncertainty about the extent of Fed control of short-term rates. I think this conclusion is also implied by earlier work, but the problem typically goes unstated in the relevant studies, which generally interpret the evidence with a strong bias toward a powerful Fed.

An interesting attempt at isolating compensated equity risk, using a measure called "Excess Conditional Value at Risk":
Research that has led to the low-volatility anomaly in cross-sectional stocks from a similar universe indicates that volatility is not compensated with a volatility premium. The authors find evidence of a risk premium, but it depends on the definition or measure of risk. Tail risk measures the probability of having significant losses, and should be what investors care about the most. This article investigates several risk measures, including volatility and tail risk, and finds that volatility is not compensated. Tail risk, however, is compensated with higher expected return in both U.S. and non-U.S. equity funds.