Tuesday, July 8, 2014

Risk & Valuations, Part 7: A Risk-Based Theory of the Firm

If we view an economy as a market divided between risk buyers and risk sellers, then labor and bond holders form a class of fixed income stakeholders.  Does some of the equity premium come from the local certainty that equity holders sell to the labor class?  Can we consider a theory of the firm that consists of risk-trading?

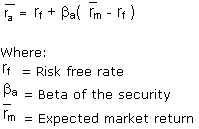
If we look at just the traditional capital structure of a firm, capital is divided between creditors and equity ownership.  Creditors receive a return that is some combination of the risk free rate of return on capital and a credit premium related to the risk of the specific firm.  Equity holders receive a return that consists of that fixed return premium plus an equity premium, which is composed itself of a market equity premium and a multiple based partly on the amount of financial leverage equity employs.  The most basic form of this idea for the whole market, from the Capital Asset Pricing Model, is this:

The return to equity in the market is a function of the risk free rate of return on capital and the premium demanded for taking the residual risk.

What if we applied this idea to labor, also.  In a fixed wage labor contract, there is a gross value of the contract that simply entails the value of the work being performed by the laborer.  But, embedded in the contract is a risk discount.  The employer promises to pay a relatively fixed amount to the laborer, so we can think of the labor contract as including a sort of swap, where the firm takes a floating payout, based on the results of operations, and the laborer takes a fixed payout.  This results in a premium paid to the firm that is a product of the volatility of operational returns and a market risk premium taken as payment for exposure to that volatility.

In other words, the laborer contract includes a rate swap.  Under the contract, the laborer owns a bonds payout and the firm takes an equity payout, complete with a risk premium that is taken as a discount from the gross value of the labor.

What if, instead of dividing the firm into debt and equity, we divide it into (1) labor and debt, together, and (2) equity, but we still apply this same model of risk premiums?  Now, we can arrive at an intrinsic value for the firm derived as such:

I will deal with this now simply on the theoretical level.  The numerical cost and level of the labor "security" is a problem I haven't worked out.  The simple regression below of Compensation to interest rates and the equity risk premium would suggest that the value of the security embedded in labor contracts increases labor compensation by about 1% for each 1% decrease in the Equity Risk Premium (ERP), although, to the extent that this relationship is legitimate, it might be stronger than that.  The jumps in compensation in the last 15 years represented disequilibria, so equilibrium compensation levels are probably closer to the lower levels seen during the recoveries.  Of course, at the firm level, this would vary by job and by firm, depending on the conditions of each labor agreement.

I wonder if this model could provide a better indication of true risk represented by a firm's equity, and of the trade-offs between labor and capital in the firm's business model.  An fully unlevered Equity Risk Premium could be calculated, reflecting the premium that would exist before equity trades risk with labor or debt holders.  Changes in operations and capital allocation could be analyzed to see how they affect that value, which would represent a sort of risk-adjusted value of the equity.

I'll also note here that this presents another way to view the effect of taxation and changing premiums on equity returns.  Just as this creates a tendency for more debt financing as base interest rates increase and equity premiums decrease (see parts 1 through 5), the usage of labor and the premium paid to labor might change with risk premiums.  As with debt, we might expect labor compensation to rise when interest rates rise and equity premiums fall.  This matches historical data!
Rates at right scale, ratios at left scale

Now, it would be difficult to establish a numerical statistical relationship here that is significant, but this is the relationship we would expect to see if we are looking at compensation through a risk-trading lens.  The current, relatively low level of compensation could be, in part, a product of low interest rates (both inflation and real) and high equity premiums.  The risk trade with compensation is mostly related to firm profit volatility.  Over time, compensation growth rates in a firm can be affected by inflation and real economic growth - wages aren't entirely fixed over time like a fixed rate bond - so it might be conceived as a sort of inflation protected, semi-floating rate security.  So, its exposure would probably be mostly related to the Equity Risk Premium (ERP), and less to the interest rate.  In fact, this is what a simple regression suggests.

At this point, this is nothing more than an indication that the data could fit the theory, because this is not a robust regression, but here is a comparison of actual compensation as a proportion of GDI and a a model of predicted Compensation, using interest rates and UERP.  Note that the actual Compensation figure tends to follow the predicted figure, with wide swings through business cycles.  Note, when actual Compensation is above the model, this is generally during downturns when unemployment is high.

We could view unemployment through this lens.  During a downturn, when there is a shock to equity values, firms become "overleveraged" with labor.  The ratio of labor value to Enterprise Value becomes too high, and firms must re-establish the labor equilibrium either through revenue growth, lower equity premiums, or higher risk free interest rates.  However, whereas with debt, firms cannot easily default; with labor, at some level of crisis, firms can "deleverage" through unemployment.

Here is a comparison of compensation, equity, and debt, over time.  Remembering the previous posts in the series, we can roughly summarize the decades:

Higher interest rates (RFR) & ERP going into the 1970s corresponds to above trend debt, below trend equity, and on trend compensation.

ERP drops going into the 1980s, which raises debt, equity, and compensation.

RFR drops going into the 1990s, which lowers debt, raises equity, and moderates compensation.

RFR drops and ERP rises going into the 2000s, which lowers debt and compensation dramatically and moderates equity values.

But, beyond these apparent relationships, when we look at compensation this way, we see that two issues with recessions: (1) the sticky wage problem and (2) the Fisher debt deflation problem are the same problem.  And the problem is essentially a cultural one.  Modern financial systems have created an economy that is tremendously efficient at trading risk.  The human demand for certainty and the local optimization that certainty allows met the modern financial system, and together they created an economy where very large subsets of the economy are not prepared to accept fluctuating financial returns during periods of manageable economic volatility.  That means that almost all of the force of volatility falls on the small group of equity holders.  And we can see this in the graph above.  Debt and labor move along in relatively straight trends, while equity bounds up and down with the business cycle.

This is well enough, as it goes.  But the problem is that unemployment and deleveraging dislocations aren't unavoidable outcomes of occasional economic fluctuations.  They are products of equity holders being pushed so far out of equilibrium value that suboptimal corporate structural changes must be instituted to regain equilibrium.  Unemployment is, to an extent, a regime specific problem.

This is one reason why policies that encourage ownership of equity are so important.  The more that economic actors can be incentivized into the residual ownership group - the group that absorbs some of the pain - the more removed the economy becomes from this regime of disequilibria.

Monday, July 7, 2014

Risk & Valuations, Part 6: At some margin, being short-sighted is rational.

A cornerstone of economic insight has always been the value of specialization.  Abundance depends on it.  We all specialize.  This means we are all optimized to an environment that is stable in relation to our competitive advantage.  If we weren't, we would be reducing our standard of living substantially.  This is the dilemma of the modern world.  Outside of cultural outliers like the Amish, we almost all take the optimized route.  Anyone reading this post certainly has.

At the extreme end of the potential outcome distribution, we have all optimized our human capital to a functioning, civil economy.  If a dystopian hellscape comes, we will all wish we had chosen to be Amish.  And, the choice isn't obvious.  It is reasonable to expect that every society will eventually devolve.  Many places in the world are currently in this position, and every place in the world has been in this position at one time or another.  Our decision to specialize has a non-zero risk.  But, the decision to specialize is almost certainly the right decision to make in the quest for a rich life.

More locally, most of us trade away the manageable portion of our risk for a fixed wage or fixed income.  Note, even here, we can't trade away the most existentially dangerous portion of our personal risk distribution.  Even when we trade the manageable risk, as a laborer, we still retain the risk of being laid off, and as a bondholder, we still retain the risk of default.

We can't trade away the most damaging parts of potential risk, so is this trade irrational?  I say no, because there is a surplus gained from trading this risk.  Utra-stability creates a regime shift in the managed part of our lives that allows a highly optimized decision tree.  If we have a very uneven income stream, it is humanly impossible to plan rationally.  The establishment of a stable plateau of outcomes, then, is very valuable, even if it can't encompass the entire range of risks.  The trading of this risk creates a surplus.  The surplus for the seller of local certainty (eg. the equity holder) is monetary (equity risk premium).  The surplus for the buyer of local certainty (labor or debt sellers holders) is non-monetary, in the form of numerous opportunities for rational planning in a stable economic context.

At a societal level, this must settle at some equilibrium.  The more citizens in a society trade away manageable risk, the fewer sellers of local certainty there are to take the other side of the trade.  We tend to approve of public policy that favors buyers of local certainty.  Most of us identify as certainty buyers.  But, the problem is that policies that make certainty more accessible move the supply/demand equilibrium for risk so that the equilibrium is more likely to be upset by economic dislocations - there are fewer investors to absorb the risk.

Public policy meant to shift risk from laborers to firms increases the value of the imbedded labor risk-trade, and necessarily will lower the compensation level that reflects the risk discount.  Policies that impose other costs on certainty sellers will also increase the premium required by firms in the labor-firm risk trade.

We normally think of risk premiums consisting of a risk free rate with a premium on top of it.  Thinking of this in terms debt holders buying certainty, it might be more clear to think of returns to the firm as the base return, and the risk free rate as a discount from the firm's total returns.  In either case, that difference would be the Equity Risk Premium (ERP).

Currently, we have a demographic situation where an unusually large number of households demand a fixed income, because baby boomers are preparing for a vulnerable time of their lives, when they will be less productive.  The equilibrium price of debt declines, which leads to decreased corporate leverage (see parts 1-5), so that capital is drawn back into equity positions, but the equity positions represent a less volatile portion of ownership, and this leads to a new equilibrium where interest rates are lower, debt levels are low, and leveraged Equity Risk Premiums are reduced due to the deleveraging, even though unlevered ERP remains high. 

The same shifts would occur between labor and equity.  The net level of compensation, after factoring in the discount for local certainty, would decrease.  The decrease in compensation would, counter-intuitively, lead to a "deleveraging" of labor.  Firms would demand less labor in the composition of risks they balance between debt, labor, and equity.  In the end, high risk premiums cause a decline in equity, debt, and labor, but especially debt and labor.  This is because of the ironic relationship between cost and leverage that causes firms to use less of them when their lower cost is the result of relative interest rates and risk premiums.  Of course, returns to equity would be high, in an absolute sense, but the nominal value of the equity would be lower, do to the higher risk premiums.

This is where we are now.  Corporate debt is low, equity prices have been relatively stagnant since 2000, and compensation is low.  Corporate earnings are healthy, which we should expect with low corporate leverage and a high equity premium.  The outlet, then for all that demand coming from buyers of local certainty is real estate.  Real estate provides access to relatively fixed incomes as both debt (mortgages) and equity (the homes themselves, with rent, or implied rent, as the income).  So, we see an inflow of capital into real estate, associated with a low risk free interest rate.

Wednesday, July 2, 2014

Risk & Valuations, Part 5: A theory of asset allocation

Considering all of these relationships (in parts 1 through 4), it seems that the fully diversified allocation of investments would (assuming a 60% equity share of assets) start with a 60% equity position (which is really a 100% long position in corporate assets, and a 40% short position in corporate bonds) and pair that with a long 40% bond position.  This gives a net position that is 100% long on productive assets, by being allocated 60% equities and 40% bonds, for a total allocation of 100%.

In this new asset allocation system, when firms leverage up so that equity becomes 50% of total assets, investors should decrease their equity share to 50%.  This would provide a level risk-adjusted exposure to productive assets.  If firms are adjusting leverage over time because of interest rate levels, then this will pull the portfolio into bonds when bonds are earning more, and it will adjust for the financial leverage embedded in the market equity portfolio as it changes over time.

To the extent that leverage changes as a result of cyclical shocks to equity value, this method of allocation would not necessarily be optimal, because it would not call for significant rebalancing into equities during sharp market downturns.  Equities would naturally reflect higher leverage during these times, and so this portfolio allocation system would lower the target equity allocation as the market value of equities declined.

The advantages of contrarian investing and naïve rebalancing are well known.  So, to the extent that this form of allocation avoided contrarian rebalancing, it would probably hurt cumulative returns.  To some extent, the normal, naïve method of rebalancing is a sort of white lie of omission that we allow ourselves to ignore.  By pretending that equities in a downturn represent the same security that they did in pricey markets, we can trick ourselves into ignoring our risk averse nature in order to buy more equities when they are more risky.

On the other hand, a manager of a sophisticated portfolio might use this model to clarify the fundamentals of a volatile market.  It is probably almost always a good idea to take the contrarian position in equities, and to push them back to, say, 60% of your portfolio when the market has pushed their values down to only 50%.  But, it might be wise and useful to understand this position as a tactical one.  Naïve rebalancing appears to be a passive investment strategy, but is instead a contrarian speculative strategy.

On the other hand, if there is systematic herding behavior in markets that is sub-optimal with regard to cumulative returns (and there certainly is, for perfectly defensible reasons), then an EMH-based measure of passivity may be missing systematic mis-pricing, and the systematic (seemingly) tactical re-weighting of equities against this tendency might actually be the passive technique.  And, maybe, naïve rebalancing is a way to outsmart the market tactically without letting our monkey mind get in the way.

On the other hand...iocane comes from Australia, as everyone knows, and Australia is entirely peopled with criminals, and criminals are used to having people not trust them, as you are not trusted by me, so I can clearly not choose the wine in front of you....and, of course, all of this analysis is suspect, as long as we continue to be involved in land wars in Asia.

Tuesday, July 1, 2014

Risk & Valuations, Part 4: Valuations and leverage through the business cycle.

In boom times, interest rates tend to rise and risk premiums tend to fall.  In recessions, interest rates tend to fall and risk premiums tend to rise.  But, during recessions, an unexpected decrease in earnings might put firms in a position where they would want to decrease debt to re-establish an optimal capital base.  But, the problem is that in this context, firms frequently do not have wherewithal to pay down debt.

So, in economic downturns, leverage may increase coincidentally with declining interest rates.  This may appear like a confirmation of firms leveraging up when interest rates are low.  But, it is probably more a product of disequilibrium in capital markets, and more a product of decreasing equity market values than of increasing demand for debt.

We imagine Fed policy temporarily lowering short term interest rates, and we see rising PE ratios and profit margins.  We intuit that firms are leveraging up on cheap Fed-fueled capital, in a feeding frenzy of easy money.

But, firms in a downturn will be looking to deleverage, regardless of Fed policy.  If aggressive policy is appropriate, it would lead to more confidence and to a lower Equity Risk Premium, which also would increase the equity valuation and lead to deleveraging (or, after a sharp downturn, allow firms to re-establish a more deleveraged equilibrium).  As I outlined in the previous post, higher PE ratios and higher profit margins would go hand-in-hand with this deleveraging.  As the recovery matures and interest rates increase, we might then see more leverage and lower profit margins and PE ratios.

So, loose cyclical Fed policy, more properly understood, is not adding fuel of unsustainable investment demand to the economy as much as it is helping equity markets to re-establish an equilibrium level where savings demand is moving back out of debt and into equity.

When the Fed expanded its balance sheet, rates increased.
The liquidity effect in this cycle appears to have been very weak, so that interest rates on debt increased with accommodation.  So, in this cycle, while long term trends in risk free rates were low, episodes of Fed easing were actually associated with rising interest rates on debt.  In the recent recession, accommodative monetary policy was associated with higher long term bond rates, so corporate recovery would have come from increased nominal demand and decreased equity premiums.

In contrast, in the 1970's, when the Fed was too loose, aggressive Fed policies would not have lowered the Equity Risk Premium.  In that case, equity values would not recover as sharply and leverage might increase earlier in the cycle.  In fact, that is what I see in the data.  In the 1970's, because inflation was so high, demand shocks were not as sharp and subsequent Fed reactions of accommodation were not as effective.  The result was that there were less extreme fluctuations in Enterprise Value through business cycles.

Here is a picture of relative equity and debt values to help imagine the effects of economic developments and monetary policy through a cycle.

RFR = 10 year Treasury Rate, ERP = unlevered Equity Risk Premium
Each Line represents the Equity & Debt levels for a Firm with different debt levels,
from 10% debt at the left end to 90% debt at the right end

At point 1, firms have a nearly optimized debt level, with market RFR = 4% and ERP = 2%.  But, the 25% shock to Enterprise Value reduces the equity value substantially, leaving the firm more highly leveraged.  Note that a combination of operating and financial leverage mean that Enterprise Values (EV) will be much more affected by the shock than NGDP is, and Equity Value, being the residual form of ownership, will be more affected than Enterprise Value.  This hypothetical would be representative of a downturn similar to the recent recession, with a decline in NGDP expectations of just a few percentage points, leading to a 25% decline in EV, and a nearly 50% decline equity values.

At point 2, market premiums have adjusted so that RFR = 2% and ERP = 3%.  Especially in the earlier parts of a down cycle, most of these premium adjustments reflect changing market sentiment as opposed to Fed management.  Note that the maroon line to the left of point 2 represents Enterprise Value at the new lower demand level if premiums had remained at RFR=4% & ERP=2%.  In this case, with no decline in RFR, firms would have been incapable of carrying the original debt levels.

So, to recover, firms need to either see a recovery in expected demand, or a decline in RFR or ERP.  I think a visual perusal of the graph will suggest that the order of effectiveness of these changes, from most to least, is (1) demand recovery, (2) ERP decline, and (3) interest rate decline.  For instance, the 1%RFR/3%ERP context achieves higher EV and lower leverage than the 3%RFR/1%ERP context.  I believe that, generally, this supports NGDP targeting as a Fed paradigm, as the recovery in demand (whether inflationary or real) should be the primary focus.  Furthermore, the relative indifference corporations would have between reduced ERP and reduced RFR, with some preference for reduced ERP, the relative lack of direct control of the Fed over longer term rates, and the general relationship these premiums have to expectations, would suggest favoring expectations management over rate targeting.

I will also note that, from the Federal Reserve z.1 data, interest paid on corporate debt appears to roughly follow trends in long term rates, possibly with some lag.  Short term rate reductions might allow firms to reduce some interest expenses, on the margin, but they would not lead to a cumulative reduction in debt expense of the scale necessary to make a difference in corporate balance sheet recoveries.  Empirically, it's not clear that there is any coherent pattern in actual corporate debt expense due to the effect of monetary policy on short term rates.  The same might be said of ERP, simply because it is more difficult to measure.


Profit Margins and PE Ratios

Here is a graph of expected profit margins at different leverage levels, and different interest rate and risk premium contexts.

As interest rates (RFR) go up, leverage goes up, Enterprise Value goes down, and Profit Margins go down.

As risk premiums (ERP) go up, leverage goes down, Enterprise Value goes down, and Profit Margins go up.

We are now in a low RFR, high ERP context.  Profit margins will be exceptionally high for reasons simply related to risk premiums and firm leverage.  Leverage is currently low, as this model would predict.

Before we even account for changing levels of capacity utilization, demand, and relative costs, etc. we should expect to see a cyclical pattern in profit margins, presenting some difficulty in interpretation.  During the expansion, Enterprise Value and profits will be healthy, but with high RFR and low ERP, profit margins may be declining during the expansion.  They will decline even more as the initial operational dislocations of a recession take hold.  But, then, as RFR declines and ERP increases, as firms are able to deleverage back to comfortable balance sheet levels, margins should recover, hitting their highest levels early in the recovery, before RFR and ERP revert back to expansionary levels.

PE Ratios differ, in that both rising RFR and ERP make PE ratios decline.  As a result, cyclical changes in PE ratios tend to relate to changes in expected growth from the current profit levels.  But, longer term comparisons would lead us to expect PE ratios to be higher than normal now, since real interest rates are low in comparison to real growth expectations.  Below are the PE Ratios of our hypothetical firm, as leverage, RFR, and ERP change.

Monday, June 30, 2014

Risk & Valuations, Part 3: Low interest rates do NOT lead to higher leverage (in practice)

My previous post described a model that would call for more debt in a corporate capital structure as debt becomes more expensive.  So, how does this play out in the real world?

It's a little tricky to pluck out of the data because there are cyclical factors, supply factors, monetary policy factors, etc., and all these factors are endlessly tangled up with interest rates and equity premiums.  But, I think I can at least suggest plausibility.

As a reminder, here is my graph from the previous post, demonstrating the counterintuitive consequences of changing debt and equity rates.  This was based on valuing a firm with the Black-Scholes model, treating the entire firm as the underlying asset, the equity as the call option, and the interest expense of the debt as the premium on the option.

This model predicts:

Falling Unlevered Equity Risk Premium (UERP) leads to:
(1) steeply increasing Enterprise Value (EV) (proxied in the graph by Share Price)
(2) slightly increasing leverage.

Falling Risk Free Interest Rates (RFR) lead to:
(1) increasing EV, though not as steeply as UERP
(2) steeply decreasing leverage.

If UERP declines and RFR increases by an equal amount, the net effect is a sharp increase in leverage and a small increase in EV.

In order to test the idea on historical data, I used data from the Federal Reserve Z.1 Financial Accounts report.  Using annual data beginning in 1960, from the Nonfinancial Corporate tables, I used profit before and after tax, interest paid, corporate equity, and credit market instruments from the Financial Accounts report, and added the 10 year Treasury Yield, the GDP Price Deflator, and  analyst growth estimates from NYU's Aswath Damodaran, who maintains several important data sets.  I use 10 year treasury rates because non-financial corporate interest expenses appear to track this rate.

I was able to derive several descriptive variables of nonfinancial US corporations over time, including ERP, UERP, and implied PE ratios.  The rates for corporate debt and the ERPs seem to be much higher for this data than they would be for, say, the S&P500, which is understandable.  But, the patterns appear to be similar.  Here is a comparison of my derived UERP to Damodaran's ERP, which I have adjusted to account for leverage.  Though my z.1 derived UERP is higher, the patterns are similar.

Below is a review of corporate leverage and capital premiums over the past 52 years.  The patterns roughly fit the counterintuitive predictions of the model.  (Enterprise Value is the combined value of debt and equity.)

Keep in mind when comparing equity and debt levels, they are on a log scale.

Enterprise Value stagnates when UERP is high.  Leverage increases when RFR is high.  In the great moderation period, corporate leverage has been countercyclical.  Note that debt levels are fairly constant and that most of the change in leverage is from variations in equity value.  Note that when UERP declined in the 1980's while RFR remained relatively high, EV growth increased and leverage remained high.  It was only after RFR continued to decline in the 1990's that debt declined.  Debt/Enterprise Value was at 47% in 1985 when RFR was 10.6% and it was still at 46% in 1990 when RFR was 8.6%.  (D/EV is shown in the graph below).  When RFR dropped to 6.4% by 1997, D/EV was down to 30%.  This was due to both a healthy increase in EV and a marked stagnation in debt growth.  After the shock to equity values in 2002, D/E quickly pulled back to 31% in the recovery, and, while debt started to increase in real terms after 2004, D/E continued to decline toward 30% as the economy grew.  Now, D/EV is again falling through the low 30%s as the economy stabilizes.


Both measures derived from Federal Reserve Z.1 report,
Non-financial Corporate Levels
For consistency in the peaks in EV and the duration of the stagnation, I compared 1968 to 2000 in the graph above.  In fact, leverage in 2000 was cyclically depressed due to high equity valuations stemming from growth expectations (see graph at right), so the cyclically neutral starting leverage of the low rate period was probably closer to 30%, and leverage is continuing to fall, and is now below 32%.


Note also that P/E ratios move inversely to leverage.  This is partly because when there are high growth expectations, equity values get bid up, as in the late 1990's.  But, it also reflects the fact that in low leverage contexts, equity has lower risk and volatility.  We tend to think of speculative firms as high PE firms, because the high PE is driven by growth expectations (like in the late 1990's).  But, imagine a firm that issued shares and simply invested them in short term treasuries, with a 100% payout ratio.  If it earned 2% returns, it would trade at a PE of 50.  So, high PE ratios during times of low interest rates aren't the result of firms fattening up on cheap debt.  Rather, they are a result of low leverage and a lower equity premium for the average firm.

Look again at the graph above of the Unlevered Equity Risk Premium (UERP) over time.  Notice how it was relatively high in the late 1970's and is relatively high now, and was low in the 1980's & 1990's.  Now, look at the smaller chart on PE Ratios and Debt/Enterprise Value.  The late 1970's had PE ratios around 10, but lately, PE ratios have been in the teens.  This is partly because low interest rates cause values of all durable assets to rise (the discount rate in a CAPM model would be lower, for instance).  But, partly, this is because the lower interest rates counterintuitively lower leverage, which, in turn, lowers the required return on equities.  Note the same discrepancy in the 1980's and 1990's.  The UERP was very low throughout this 20 year period.  When interest rates were still high, leverage was still high, so PE ratios were held down.  But, when interest rates fell in the late 1990's, leverage fell dramatically.  The astronomical valuations at the time were partially a product of high growth rates, but even before factoring in the high expectations, PE ratios would have been extremely high.  If I adjust Damodaran's ERP for leverage, it is pretty stable from 1985 to 1997.  But, the market ERP, which reflects the market's typical leverage, fell by a full point during that time.  So, when risk free interest rates fall, using a CAPM-type valuation measure, there is a multiplier effect due to the fact that the Equity Premium might also fall with it, due to declining financial leverage.

So, when interest rates fall, we frequently see rising stock prices.  This is commonly attributed to firms boosting net earnings by leveraging cheap debt.  But, this simply does not bear out, empirically.  Lower rates do cause the value of productive assets to rise.  But, this is related to deleveraging.  And, thus, the rising stock market is related to lower risk.

When I divide the interest rate into an inflation premium and a real rate, the inflation premium is the stronger influence on corporate leverage.  This is because the real rate is a sort of price of debt that reflects both supply and demand.  The inflation premium carries the tax consequences of debt versus equity for a corporation more purely.  Note also that the two surges in D/EV since 2000, when interest rates were low, were from crashes in Enterprise Value, not from planned increases in Debt.

NOPAT = Net Operating Profit After Tax
10 Year Treasury Rate is on right scale, inverted
Here is one more graph, showing Equity and Debt over time, as a proportion of NOPAT.  NOPAT is Net Operating Profit After Tax.  It's profit after tax, but before interest expense - kind of the unleveraged profit of the firm.  What's interesting is that we think of interest rates as an incentive for debt utilization.  But, what we see here is that debt has been remarkably level through both extremes of interest rates.  The effect of lower interest rates on productive investment flows mostly through equity values.  And, maybe the tax issue is a red herring.  Maybe creditors are comfortable with a general relationship of Debt/NOPAT because avoiding default is paramount, and this keeps potential debt levels under a cap.  Equity is not encumbered by this concern, so that interest rate induced increases in enterprise values must be accommodated with equity.  Also, note that under about 5% (10 year treasury rates), interest rates seem to lose their power to increase equity values.  Maybe this is because rates in this range are suggestive of underlying economic problems or are associated with deflationary distortions of economic activity.  It does make one wonder how effective we could have expected Fed policy with the stated intention of pulling down long term interest rates well below 5% to be.

The ratios above tend to make cyclical effects hard to track, because the denominators tend to go batty during downturns.  So, here is Debt (Nonfinancial Corporate Credit Market Liabilities) as a percentage of Potential GDP, graphed alongside the Fed Funds Rate.  Note that the level of debt declines as the rate declines, remains low when the Fed Funds Rate bottoms, and only tends to rise again after the Fed Funds Rate has risen and plateaued.  Debt is rising now, as a proportion of Potential GDP, in spite of the low Fed Funds Rate, but as shown in the graph above, it's still declining as a percentage of corporate capital.  That's kind of the opposite of what everyone knows, isn't it?  Isn't there a story in the paper every day about how corporate profits are high because the Fed is enabling them to leverage up with cheap debt?

This reminds me of the idea I considered recently of Treasury Bonds and Real Estate as a sort of Giffen Good for savers.  I noted how levels of Real Estate and Securities in Bank Credit (government bonds) moved inversely to interest rates.  The levels of credit have been higher when rates have been lower.  Commercial & Industrial (C&I) loans as a proportion of GDP have not followed this pattern and have declined, just as Corporate Debt as a proportion of Enterprise Value has declined as interest rates have declined.  Could the divergence of corporate debt levels from these trends among other types of credit be related to this corporate tax issue that makes debt financing more desirable in high interest rate environments?

These peculiarities change the way we might imagine firms moving through the business cycle, which I will review next.

Thursday, June 26, 2014

Risk & Valuations, Part 2: Low interest rates do NOT lead to higher leverage (in theory)

Building on the previous post, if we imagine a firm with the following beginning characteristics:

$500 million Debt
$500 million Market Capitalization
$25 million   Annual Interest Expense

then, if we view equity as an option on the enterprise (basically the Merton Model), we have a call option with a Strike Price of $500 million, an underlying asset value of $1 billion, and an option premium of $25 million per year (in the form of interest).

Now, imagine the market outlook for this equity rises, and the Enterprise Value increases to $1.5 billion.  In this Merton-like way of looking at it, we are now paying a $25 million premium for a call $1 billion in-the-money, compared to the original position which was paying a $25 million premium for a call only $500 million in-the-money.  From this perspective, the premium values have gone up.  (On options, the premium usually declines as the strike price moves away from the underlying asset price.  This change in relative rates means that the "strike price" of equity shares is more "in the money", but is still paying the same premium.)

There could be several causes of an increase in value:

1) Decreased Equity Risk Premium

2) Decreased Debt Interest Rate

3) Increased Expected Earnings

Or, an example in the opposite direction (shown in the above graph):

Imagine that interest rates change so that interest expense is $50 million, but equity risk premiums remain stable.  Enterprise value will decrease, because the higher premium will mean that equity holders bid the Enterprise value down so that they are less in-the-money than they were when the premium was lower.


Here is a graph of payouts to equities, presented as call options.  Just as call options limit the loss of the buyer to the strike price, equities limit the loss to the firms' owners to the level of equity.  In effect, debt holders are selling call options on the enterprise to the equity holders and charging them a premium.  The difference in premiums is barely noticeable in this graph because the premiums are very low compared to the enterprise value.  There are two reasons. (1) Equities are generally very "in-the-money".  There is usually a low chance of bankruptcy, which would be the equivalent of having the options expire out of the money.  (2) Most call options expire within a few months or years.  Equities are call options with no expiration date.  I am expressing the premium here in annual terms, and the annual premium will be very small compared to the perpetual value of the equity.  On an actual call option, the premium is paid up front and sort of amortizes away over time.  With debt, interest is accrued and paid periodically.  But, this doesn't really change the analogy.

The next graph is a view of the annual proportional returns to equity in the same 3 scenarios.  Again this looks very much like a graph of returns on a set of call option contracts with different strike prices or different levels of implied volatility.  There is a tradeoff between a lower breakeven level (where the line crosses the y-axis) and the slope of the payoff line as a percentage of the price of the options.

A lower equity risk premium (by increasing the market capitalization) or a lower interest rate (by lowering the "premium" on the equity option) both have the effect of leading to a new equilibrium enterprise value that lowers the slope of the proportional payout and pulls the y-axis breakeven point up toward zero.  And vice versa.

So, holding earning potential stable, the value of the firm is a product of the relationship between debt interest rates, equity risk premiums, and leverage.  And, note that, when the relative required returns of equity and debt holders diverge, the scenarios above point to higher leverage when debt is relatively more expensive!  (In hindsight, I'm getting ahead of myself.  I don't think this last sentence is supported by the simple analysis above, but it is by the analysis below.)

What about leverage?

Conventional wisdom is that firms leverage up when interest rates are low.  But, some financial analysis gives the opposite intuition.  The Modigliani-Miller Theorem posits that we should be indifferent to debt vs. equity, as, in a market without asymmetrical frictions, the risk premiums should adjust with leverage so that Enterprise value is unaffected.  From this starting point, debt is favored due to preferential tax treatment.  As leverage increases, the cost of both debt and equity increase, so there is usually some optimal leverage level where enterprise value is maximized.  As with the scenarios above, counterintuitively, since higher relative debt expenses create more tax savings, this model suggests that the higher the relative cost of debt, the more debt a firm should utilize.

If we price equity as a call option, using Black-Scholes, this is indeed the outcome we get.  Here is the graph of the relative value per share of a single firm in various interest rate contexts.  All operational expectations and tax rates are constant here.  All of these changes are a product solely of interest rates.

Capital Asset Pricing Model (CAPM)As a reminder, here is the Capital Asset Pricing Model:

The discount rate applied to the future cash flows of a firm, for the purposes of valuation, is a combination of the risk free rate, the relative market-correlated volatility of the firm's equity (Beta), and the Equity Risk Premium (expected market return minus the risk free rate).

So, the following graph displays the relative value of a share of stock in a company whose equity is valued with a Black-Scholes model using Enterprise Value (equity + debt) as the underlying asset on the option.  Expected volatility, tax rate, revenue, and earnings are stable.  The variables that change are the risk free interest rate (RFR), the unlevered Equity Risk Premium (ERP), and the amount of debt the firm uses.  The required return on equity is RFR+ERP.  Each line shows the share value of the firm with a given RFR/ERP combination, as the debt level increases.


I hope this graph isn't too difficult to read.  Basically, enterprise value increases with leverage, because of the tax benefit from interest expense.  But, default risk and equity volatility both rise as leverage rise, so at some level of leverage, the after-tax discount rate applied to expected cash flows becomes more powerful than the tax advantage, pushing enterprise value down at extremely high leverage levels.

Note that, as we should expect, valuations rise for the unleveraged firm (no debt, all equity) as the composite interest rate declines (see labels on left scale).  But, because of the tax advantage of debt, the other relationships between rates and valuations are counterintuitive.

If ERP is stable, but RFR falls (the red arrows), the cost to the firm for debt and equity would both fall.  Intuition would suggest that firms might leverage up in response to cheaper debt, but because of the counterintuitive value of debt, the optimal firm would deleverage.

If RFR is stable, but ERP falls (the purple arrows), the cost of debt would remain stable, but the cost to the firm of equity would fall. Intuition says this should cause firms to offer more equity, because investors will demand fewer earnings for the same amount of capital.  Again, the optimal firm does the opposite, and leverages up with debt, even as enterprise value rises.

Finally, if RFR rises while ERP falls by an equal amount (the green arrows), the cost of equity remains stable while the cost of debt rises.  Surprisingly, even though the discount rate on equity capital has not changed, (so that the value of the unlevered firm would not change at all) the optimal firm can increase its Share Price and Enterprise Value by leveraging up, and trading equity for debt as the debt becomes more expensive!

For instance, look at the scenarios where the cost of equity capital is 5%.  For the scenario where RFR=1% and ERP=4%, the firm's Share Price is relatively unresponsive to leverage.  But moving up to the scenario where RFR=4% and ERP=1%, now the firm can leverage up with the more expensive debt and increase its Share Price by nearly 20%, just by adjusting its capital base...to the now more expensive debt!

PS
If this seems like it can't be true, keep in mind that the beta of the firm's equity is increasing with leverage.  So, if RFR=2% and ERP=3%, then the unlevered firm's equity will require 5% returns.  But, when the firm replaces 50% of the equity with debt, the firm's earnings per share will be twice as volatile, so equity will now require 2+(2*3)=8% returns.  So, for firms that have required returns to equity of 5% when they have no debt, the required rate of returns will rise more for the firms with higher ERPs as debt (and beta) rises.  So when we compare these firms that have equal unlevered valuations as they utilize debt, earnings per share will be higher when debt is cheaper, but risk adjusted value to equity in these cheap debt scenarios will be lower.

An Aside

I will dig into the implications of this in upcoming posts, but as an aside, this analysis shows one of the many ways that taxes on capital damage an economy.  The advantage of leverage is greatly increased by the presence of corporate taxes.  If we didn't tax corporate profits, firms would tend to be much less leveraged.  Ownership would be more widely spread, and the economy would be less vulnerable to panics, crashes, defaults, and bankruptcies.

Tuesday, June 24, 2014

Risk & Valuations, Part 1: Leverage and Profit Margins

I would like to begin this series by addressing the notions that corporate profit margins and P/E Ratios are unsustainably high.

Let me preface this by saying this is not intended as a bullish forecast of equities.  But, if equities decline, it will not be because P/E ratios are too high or profit margins are unsustainable.  The reason is that the relationships between these measures and corporate values are not stable over time, especially when corporate leverage is changing.

First, let me compare firms with exactly the same operating results and sum-of-the-parts valuation premiums, but with differing levels of leverage.  I will assume static interest rates and risk premiums, and book values equal to market values.  (Edit: next line should say "different financial leverage".)


As firms deleverage, all else equal, valuations and net margins increase.  These changing valuation metrics are not signs of truly higher valuation multiples.  They reflect the fact that the equity holders are buying a fundamentally different security that happens to go by the same name.

If we think of equity as a perpetual call option on the firm's unlevered assets, then if we compare a firm at two points in time that moves from context 4 to context 3, we can treat the enterprise value as the asset price, the equity value as the strike price, and the annual interest expense as the option premium:
Firm
Asset Price
Strike Price
Annual Premium
4
$1 Billion
$500 Million
$25 Million
3
$1 Billion
$250 Million
$12.5 Million

So, a firm that undergoes a fundamental change in leverage is like a call option with a different strike price.  (As an aside, with options, the strike price is set and the premium changes with market sentiment.  For a firm with stable leverage, the premium and strike price (interest expense and debt level) remain stable, so if market sentiment changes, it's the underlying asset price (enterprise value) that must change for the market to clear.)

Or, thinking of it another way, an investor with $500 million could borrow $500 million and buy Firm 2 at a firm P/E of 10, and get the same payout as she would if she simply bought the equity of Firm 4 at a firm P/E of 6.67.

Changes in these measures can simply reflect a change in leverage.

There are several financial market fundamentals that this simple model demonstrates.

1) The changing PE ratios are a product of the Equity Risk Premium, which changes as beta changes.  If the volatility of the market as a whole changes, as the result of deleveraging or of improving growth prospects, PE ratios for the whole market will rise.

2) The debt in this model assumes negligible credit risk.  Corporations normally use debt with credit risk, and the level of debt is determined by the leverage that produces the highest enterprise value, given the implied market risk premiums for different funding sources.  There are a lot of moving values in that mechanism which the simple model above is not concerned with.

The point of this simple model is that corporations could be adjusting their leverage for reasons related or not related to the 2nd point above.  A demand shock might cause corporations to delay some investments even though they don't want to shrink their capital base over the long run.  Or, the market may be moving to an equilibrium with lower leverage for any number of reasons - equity investors may be less willing to pay for beta, pushing the market leverage level down.

High PE's can certainly signal a dear price.  But, high PE's and high profit margins, together with lower leverage, can also, ironically, signal safety.

Monday, June 23, 2014

Risk and Valuations - A Series

I have been thinking about the effect of changing risk appetites and economic activity, and I believe that the product of these relationships is frequently counterintuitive, so that conventional wisdom about changes in the marketplace is informed by imperfect intuitions.  These wrong intuitions then form the foundations for additional interpretations that are built on shaky foundations.

I hope some of these ideas are new and useful.  I realize that I'm going down the rabbit hole a bit here, and am demanding a bit of attention from my readers.  I hope you find these ideas compelling enough to think about them and follow me all the way through.  Feedback is welcome, especially if you make it through the entire series.

I will post these ideas in a series.  I hope to post about 3 parts per week until the end:


Section 1: Valuations, Interest Rates, and Asset Allocation


Part 1: Leverage and Profit Margins
Valuation ratios and net profit margins measure a moving target.

Part 2: Lower interest rates do not lead to higher leverage (in theory).

Part 3: Lower interest rates do not lead to higher leverage (in practice).

Part 4: Valuations and leverage through the business cycle.

Part 5: A theory of asset allocation
Maybe asset allocation should account for the level of corporate leverage.


Section 2: Risk Trading and Robust Societies


Part 6: At some margin, being short-sighted is rational
We are optimizers.  Certainty is very valuable.

Part 7: A Risk-Based Theory of the Firm
Equity holders buy risk from both labor and creditors.  Can we model firms based on risk-trading?

Part 8:  Beta has its own alpha
There could be discrete changes in risk when moving between asset classes.

Part 9: The Greenspan Put
Stay calm and NGDPLT.

Part 10: Risk Aversion and Demand for High Wage Labor in International Markets
Production doesn't move to where wages are low, it moves to where wages are rising!

Part 11: Allocations with Stocks & Bonds
If risk trading is the main factor determining risk premiums, then inflation-protected fixed income might provide decent diversification benefits.

Thursday, June 19, 2014

Mortgage Cramdowns and Monetary Accommodation

There have been programs for mortgage reductions and calls for more.  It strikes me as an unusual position.  Essentially, it is a type of bankruptcy proceeding where the equity holders retain full ownership.  I see the proposal being proposed for homeowners.  I wonder if anyone ever proposes it for commercial contexts?  Where the government intervened with GM to alter the proceedings against the bondholders, it appears to have been for the benefit of the labor unions, not the previous equity holders.

I wonder how markets would differ if that was the norm.  What if bankruptcies triggered haircuts for creditors, but equity holders  retained their ownership?

Debt would be a lot more expensive and a lot more cyclical.  Creative destruction and flexible asset allocation would be hampered.  Banking would be very difficult.

Is the housing context so different from the commercial context that the case for housing cramdowns could be that much better than the case for equity-friendly corporate cramdowns?

I suppose an Austrian critique of monetary policy is that monetary accommodation is exactly this - a haircut for creditors while the equity holders retain control, which hampers creative destruction.  So, maybe the incoherent position would be to support monetary accommodation but not to support housing cramdowns.

But that is my position....Culturally, or pragmatically, we accept that the underlying value of currency is flexible, whereas the legislated alteration of mortgage contracts seems like the undermining of the respect for contracts, an important feature of a civil economy.  I'll admit that this is a somewhat arbitrary distinction.  Both actions involve discretionary public policy with clear winners and losers.  Hmm, cognitive dissonance....

Tuesday, June 17, 2014

If we are the 100%, then who will be the scapegoat?

On the heals of yesterday's post, I came across this unfortunate post by the usually great Bill McBride, at www.calculatedrisk.com.  In it, he pulls out the old canard that corporations like high unemployment because it pulls down wages.  To concoct this story, you begin with (1) the truism that prices move inversely to excess supply, so that, similar to any good or service, wages tend to stagnate when unemployment is high.  Then, you add (2) the truism that, as with any buyer, a corporation would prefer lower prices over higher prices.  Sprinkle liberally with assumptions of sociopathic levels of self-interest, and a wink-wink about how we all KNOW how THEY are, and Voila, you have (3) corporations love it when you are hurting.

He even manages to point to the very Paul Krugman quote that I originally linked to critically on this topic, at the end of this post.  Of course, he likes Krugman's comments.

Here is a quote McBride has from Kash Mansori:
[T]his opens up an interesting line of reasoning, one that is certainly not new but which this data reminds us of. If a bad labor market means that workers get a smaller share of the productivity they bring to their employers, then the owners of companies will have a strong preference for a weak labor market. Firms don't like recessions, of course -- it's hard to make money when your sales are falling. But companies do enjoy the way that a very slow recovery in the job market can allow them to keep wages down, and thus keep a larger share of the output of their workers for themselves. 
Let's see.  How about this:
If recessions mean that firms don't have enough demand for their products, then consumers will have a strong preference for a weak economy. Consumers don't like recessions, of course -- it's hard to make money when you lose your job. But consumers do enjoy the way that a very slow recovery in GDP can allow them to keep prices down, and thus keep a larger share of the output for themselves.
How about this:
If a supply shock means that consumers have a shortage of products and services to choose from, then workers will have a strong preference for natural disasters. Workers don't like natural disasters, of course -- it's hard to make money when your town is in disarray. But workers do enjoy the way that natural disasters create demand for labor at high wages, and thus they keep a larger share of the output for themselves.

Of course, that last version is sometimes stated favorably!  In fact, replace "natural disasters" with "immigrant roundups" and many people consider it the explicit basis of public policy!

So, I just stated the same argument with the characters changed.  Oddly these three paragraphs garner very different reactions:

1) Exactly!  We need to counteract this terrible preference that corporations have!

2) That's stupid.  Of course consumers don't want the economy to be sour.

3) Exactly!  The destruction is terrible, but at least it will put people to work!

I would like to put a vote in that our reaction to version #2 is the correct reaction to all the versions.

By the way, here are US Total Compensation and US Domestic Corporate Profits, Indexed to the previous peak of profits in 2006 3Q.  First, a close-up since 2006, then a graph all the way back to 1947.

And let's be clear about what these three gentlemen above are declaring: that corporations (the BLUE line) secretly like extended economic dislocations because it gives them an advantage in bidding down labor compensation (the RED line).  Without further comment, here are the graphs of Wall Street's "Dirty Little Secret":


Well, OK, I will make one further comment, because I realized that this is another example in a running theme here at IW that interpretation trumps everything.  Here is the article at "A Wealth of Common Sense" that triggered Bill's rumination.  The article discusses how times of economic distress are good times to invest with risk.  But, there is nothing in that article about corporations gaining at the expense of labor.  The closing paragraph is:
Yet it’s still true that expectations matter with forward looking markets. This is why the best time to invest is when assets are beaten down in price with low future expectations as opposed to those times of sky high expectations and large price increases.
This was an article about sentiment and contrarian mentality.  If anything, the article runs along with the point I have been making - we're all in this together - capital recovers when labor recovers.  Yet for Bill McBride, the article reinforced the exact opposite viewpoint - that corporations recover at your expense.

You know those little toys you can get where you can only read a secret code if you place a little red plastic lens over it that filters out some of the colors?  In complex matters, most of the time we don't need the little plastic lenses - and I'm talking about all of us here, even though it's going to take someone else to point my filters out to me.  That's the thing about filters.