Oh, I forgot to update the flows information. Here's the graph, updated for January:
This is a strong showing for January. The flow from "Not in Labor Force" to "Employed" came back with a vengeance. The previous decline in that category was odd, but that trend has been eliminated now. I thought at first that this was just due to population adjustments, but the BLS notes say that the adjustments are not nearly large enough to explain that jump. Of course, this data tends to be noisy, but the size of the shift is a pretty clear statement about the pattern we want to see in that series of increasing flows over time.
The Employment to Unemployment flow reverted back to the trend, but the trend is still decreasing, and it remains well below the Unemployment to Employment flow.
Net shifts were firmly into the Labor Force and into Employment.
Friday, February 7, 2014
January Employment
The last two months, the word "disappointing" has gotten thrown around a lot. The great thing about employment reports, for a speculator, is that there are enough independent and noisy variables floating around inside them that the cyclical biases of the zeitgeist will usually find their way into the headlines and the pundit reactions. The last two months have been great examples of that. If we keep getting disappointed like this, we'll be seeing full employment and rising interest rates by the end of the year. This is a setup for a profitable contrarian position that gains from a strong labor market.
This labor report gave us everything we should want, and the unemployment rate even overcame last month's excessively low short-duration unemployment noise to tick down another tenth. This month saw a tick up in labor force participation and a large drop in "part-time for economic reasons", which has been slow in coming. There isn't much to be disappointed about in the household data. Yet, forward interest rates tickedup down on the release.
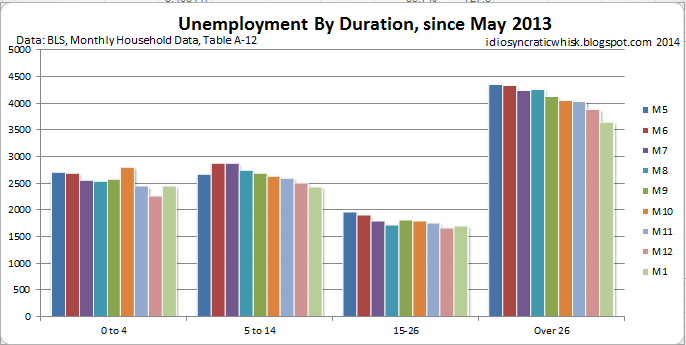
Here's an update on unemployment, by duration:
As I'd expected, the 0-4 duration unemployment from December wasn't sustainable. But, the numbers, in general, remained pretty low. We are starting to see an acceleration in the declining long duration unemployment levels. I had expected this also, and it is probably somewhat related to the end of emergency unemployment insurance.
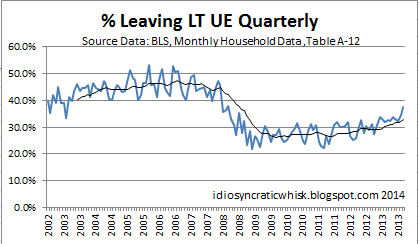
Here is a chart I have referenced before. This is a measure of how many workers who have been unemployed for more than 14 weeks exit unemployed status over the following 3 months. A healthy economy would see a level over 40%. This measure is up by 5% over the last two months, to 37.4%. If it hits 40% by March and 45% by June, we are probably looking at a 6% unemployment rate by June and a 5.5% rate by December. The recent post-EUI employment changes in North Carolina suggest that these projections are not out of line.
There is this notion that transfers such as EUI create "multipliers". To me, it seems much more clear that there are multipliers from increasing employment. So, as former EUI recipients become re-employed, there will be complementary effects with the new production that do actually create a "multiplier". I would not be surprised to see a rebound in employment that exceeds the number of former EUI recipients. I think the over-under is that we shed another million from the "over 26 weeks" category by June. That is just as likely to be conservative as it is to be an overestimate.
PS. Average wages also look like they are continuing to accelerate.
This labor report gave us everything we should want, and the unemployment rate even overcame last month's excessively low short-duration unemployment noise to tick down another tenth. This month saw a tick up in labor force participation and a large drop in "part-time for economic reasons", which has been slow in coming. There isn't much to be disappointed about in the household data. Yet, forward interest rates ticked
Here's an update on unemployment, by duration:
There is this notion that transfers such as EUI create "multipliers". To me, it seems much more clear that there are multipliers from increasing employment. So, as former EUI recipients become re-employed, there will be complementary effects with the new production that do actually create a "multiplier". I would not be surprised to see a rebound in employment that exceeds the number of former EUI recipients. I think the over-under is that we shed another million from the "over 26 weeks" category by June. That is just as likely to be conservative as it is to be an overestimate.
Thursday, February 6, 2014
The End of EUI in North Carolina and Unemployment
Employment could be looking up...
This is the relative change in state unemployment rates since North Carolina prematurely ended emergency unemployment insurance, at the end of June.
Bonus Graph: Here's a histogram of the December minus July differences:
Here is an update, with Labor Force Participation and Employment-Population Ratio histograms.
Wednesday, February 5, 2014
Waiting for the January Employment Report
I have mentioned before how low the level of short duration unemployment was in December. Here's a chart from that post:
So, I think a big question for forecasting the January labor report is, what caused that dip in short duration unemployment? To give an indication of how extreme this was, below is a historical graph of 0-4 week unemployment duration:
Seasonally adjusted short duration unemployment hasn't been this low since 1974 - and this is raw numbers. December 2013 had the lowest 0-4 week duration unemployment rate ever measured. I would blame the seasonal adjustments, and maybe the timing of Thanksgiving or something, but November's figure was pretty low, too, and the 5-14 week unemployment levels don't show any unusual movements. Even in the non-seasonally adjusted numbers, the combined November/December level of 0-4 week unemployment is lower than it's been since the 1970's.

So, the BLS data doesn't expose this as an obvious anomaly. But, I would still say to be prepared for a rebound of 0.2% or so in the January unemployment rate after factoring in other issues, because there is a good chance that this was not a sustainable reduction.
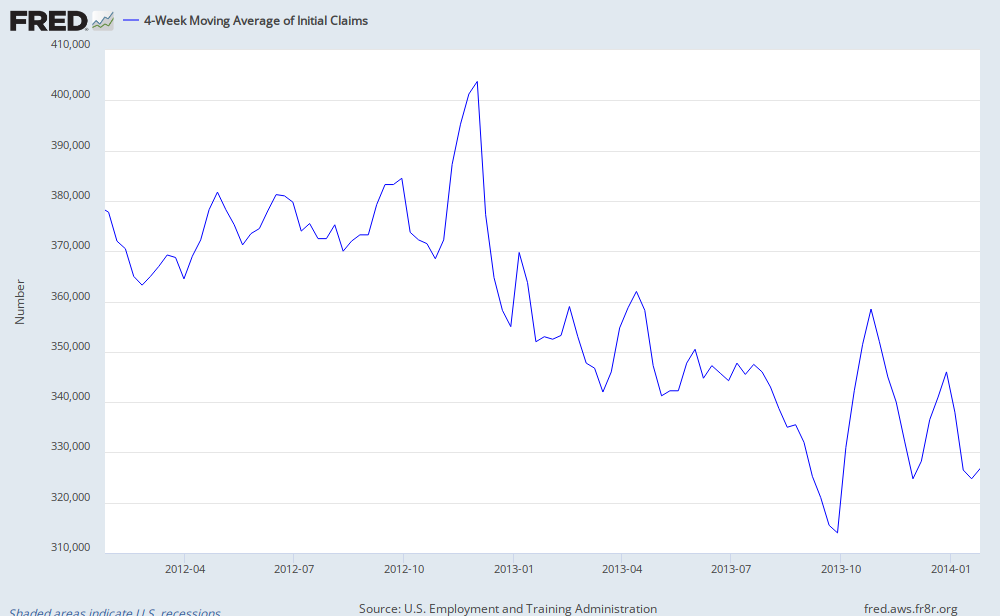
One reason the short duration unemployment might be low is because layoffs in the JOLTS data have been very low. But, initial claims the last few months have not been unusually low, although they have been unreliable lately:
And, this is not the sign of a recovering labor market. Recoveries usually see an increase in labor churn, so that low-duration unemployment doesn't change much, but unemployed workers are able to find work easier, so that long duration unemployment declines.
Another place to look for clues is the employment flow data from the CPS. Here is a chart of some of the flow patterns:
The one thing that jumps out from the last two months is a very low flow from Employed to Unemployed that is accompanied by continued strength in the flow from Unemployed to Employed. There has been a flattening out of the downtrend in Unemployed to Not in Labor Force flows, but this appears to be balanced out by a similar flattening of the uptrend in Employed to Not in Labor Force. This leaves the flow from Not in Labor Force to Unemployed, which appears to be following a normal trend, and Not in Labor Force to Employed, which has taken an anomalous turn down for nearly a year.
So, the two flows which appear to be causing the unusual decrease in the unemployment rate are (1) a very low level of layoffs and discharges (which aren't strongly corroborated by unemployment claims data) and (2) an unusually low flow of workers from Not in Labor Force directly back into Employment.
I would expect a small outflow from unemployed to not in labor force due to the end of emergency unemployment insurance (EUI), and this movement more generally is what usually is blamed for the declining labor force participation rate. On the one hand, this data shows a more complicated picture of the labor market than a story of discouraged workers. On the other hand, these recent trend anomalies don't replace that narrative with any coherent narrative that I can see. A continued downtrend in the flows between employment and Not in Labor Force might be an early sign of an economic downturn. It will be interesting to see how these numbers evolve.
I expect to see strength in the Unemployed to Employed flow, due to the end of EUI, although some of that might flow through Not in Labor Force before the dust settles. If that is the case, and we see a continued gap between the blue & green lines above, that is where I see the potential for a strong labor market for the first half of the year.
Speaking of EUI, leading up to when North Carolina halted EUI in June, they seemed to experience a similarly odd decline that, on net, was a flow from Employment to Not in Labor Force. I don't know the mechanism at work, but we now appear to have two periods leading up to termination of EUI where we have seen this flow in the data. Let's hope that on the national level we see a transfer out of unemployment into employment like we have seen in North Carolina since June.
And, speaking of North Carolina, I was surprised to see how sharply initial unemployment insurance claims have dropped there. In addition to halting EUI, they also limited regular UI, including limiting it to, I think, 19 weeks (normally it's 26 weeks). But, the size of the drop in initial claims still surprises me. (North Carolina in red, National in green, not seasonally adjusted.):
So, I think a big question for forecasting the January labor report is, what caused that dip in short duration unemployment? To give an indication of how extreme this was, below is a historical graph of 0-4 week unemployment duration:
So, the BLS data doesn't expose this as an obvious anomaly. But, I would still say to be prepared for a rebound of 0.2% or so in the January unemployment rate after factoring in other issues, because there is a good chance that this was not a sustainable reduction.
One reason the short duration unemployment might be low is because layoffs in the JOLTS data have been very low. But, initial claims the last few months have not been unusually low, although they have been unreliable lately:
Another place to look for clues is the employment flow data from the CPS. Here is a chart of some of the flow patterns:
The one thing that jumps out from the last two months is a very low flow from Employed to Unemployed that is accompanied by continued strength in the flow from Unemployed to Employed. There has been a flattening out of the downtrend in Unemployed to Not in Labor Force flows, but this appears to be balanced out by a similar flattening of the uptrend in Employed to Not in Labor Force. This leaves the flow from Not in Labor Force to Unemployed, which appears to be following a normal trend, and Not in Labor Force to Employed, which has taken an anomalous turn down for nearly a year.
So, the two flows which appear to be causing the unusual decrease in the unemployment rate are (1) a very low level of layoffs and discharges (which aren't strongly corroborated by unemployment claims data) and (2) an unusually low flow of workers from Not in Labor Force directly back into Employment.
I would expect a small outflow from unemployed to not in labor force due to the end of emergency unemployment insurance (EUI), and this movement more generally is what usually is blamed for the declining labor force participation rate. On the one hand, this data shows a more complicated picture of the labor market than a story of discouraged workers. On the other hand, these recent trend anomalies don't replace that narrative with any coherent narrative that I can see. A continued downtrend in the flows between employment and Not in Labor Force might be an early sign of an economic downturn. It will be interesting to see how these numbers evolve.
I expect to see strength in the Unemployed to Employed flow, due to the end of EUI, although some of that might flow through Not in Labor Force before the dust settles. If that is the case, and we see a continued gap between the blue & green lines above, that is where I see the potential for a strong labor market for the first half of the year.
Speaking of EUI, leading up to when North Carolina halted EUI in June, they seemed to experience a similarly odd decline that, on net, was a flow from Employment to Not in Labor Force. I don't know the mechanism at work, but we now appear to have two periods leading up to termination of EUI where we have seen this flow in the data. Let's hope that on the national level we see a transfer out of unemployment into employment like we have seen in North Carolina since June.
And, speaking of North Carolina, I was surprised to see how sharply initial unemployment insurance claims have dropped there. In addition to halting EUI, they also limited regular UI, including limiting it to, I think, 19 weeks (normally it's 26 weeks). But, the size of the drop in initial claims still surprises me. (North Carolina in red, National in green, not seasonally adjusted.):
Tuesday, February 4, 2014
Merit Pay and Institutional Effectiveness
One aspect of the debate about educational institutions that I find a little strange is the debate about merit pay.
Critics of public schools complain about results - sometimes in ways that are probably a bit unfair - and one natural area to look for solutions is at the types of accountability and performance incentives teachers and administrators face. Now, in most organizations, this is an obvious part of the work environment. There is usually an individualized set of measures applied, together with the discretion of supervisors, toward matching performance to rewards and responsibilities. All organizations are far from perfect, but I don't believe the attempt at assessment is generally questioned.
Oddly, the defenders of public educational institutions seem to argue that these institutions are singularly incapable of performing this function. Hypothetical standardized measures are deemed unfair, and administrators can't be allowed to use discretion to interpret the measures. They seem to be describing an institution that is fundamentally a failure. One of the main direct functions of these institutions, oddly enough, is the assessment of our children. You would think that if any institution had a core competency for assessment, it would be this one.
Shouldn't someone who was trying to defend public educational institutions' ability to direct and assess our children point to their innovative record in directing and assessing their own staffs?
As an aside, I note that when I google "merit pay", google auto-completes it with "for teachers". Isn't it strange that the debate only happens in this context? This highlights one of my rules of thumb. If there is a public argument about a policy, about which I am expected to have an opinion, the outcome of that argument is of little matter. The system has already failed.
Imagine all of the millions of employment relationships and commercial and technological innovations that percolate around us every day. They all work precisely because they didn't require your or my input. I have never engaged in a public conversation about the employment contract my pharmacist might have. To be honest, I don't care. And my pharmacist would agree that it's none of my business. Ditto for the organizational design, the inventory management process, or any number of other policies and relationships that were necessary in order for the pharmacist to fulfill my order. Same goes for the local bagel shop, auto dealer, or what have you. All of these places function well precisely because they don't care what I think about how they work, beyond whether I am happy with how they perform their services.
Imagine if NPR's afternoon schedule today was:
1:00pm Social justice for donut makers: How early should they have to wake up?
2:00pm Warehouses: The downside of forklifts.
3:00pm Is it fair for your car salesman to get less compensation just because you couldn't qualify for a loan?
This is one of the downsides of pulling activities into the public realm. Arrangements that generally arise with a dynamic emergent order now become matters of public policy. Matters that should be none of my business (because that's how they improve) are charged with moral gravitas. Our silent, mundane, perpetual source of progress is overtaken by a tribal pissing contest.
Critics of public schools complain about results - sometimes in ways that are probably a bit unfair - and one natural area to look for solutions is at the types of accountability and performance incentives teachers and administrators face. Now, in most organizations, this is an obvious part of the work environment. There is usually an individualized set of measures applied, together with the discretion of supervisors, toward matching performance to rewards and responsibilities. All organizations are far from perfect, but I don't believe the attempt at assessment is generally questioned.
Oddly, the defenders of public educational institutions seem to argue that these institutions are singularly incapable of performing this function. Hypothetical standardized measures are deemed unfair, and administrators can't be allowed to use discretion to interpret the measures. They seem to be describing an institution that is fundamentally a failure. One of the main direct functions of these institutions, oddly enough, is the assessment of our children. You would think that if any institution had a core competency for assessment, it would be this one.
Shouldn't someone who was trying to defend public educational institutions' ability to direct and assess our children point to their innovative record in directing and assessing their own staffs?
As an aside, I note that when I google "merit pay", google auto-completes it with "for teachers". Isn't it strange that the debate only happens in this context? This highlights one of my rules of thumb. If there is a public argument about a policy, about which I am expected to have an opinion, the outcome of that argument is of little matter. The system has already failed.
Imagine all of the millions of employment relationships and commercial and technological innovations that percolate around us every day. They all work precisely because they didn't require your or my input. I have never engaged in a public conversation about the employment contract my pharmacist might have. To be honest, I don't care. And my pharmacist would agree that it's none of my business. Ditto for the organizational design, the inventory management process, or any number of other policies and relationships that were necessary in order for the pharmacist to fulfill my order. Same goes for the local bagel shop, auto dealer, or what have you. All of these places function well precisely because they don't care what I think about how they work, beyond whether I am happy with how they perform their services.
Imagine if NPR's afternoon schedule today was:
1:00pm Social justice for donut makers: How early should they have to wake up?
2:00pm Warehouses: The downside of forklifts.
3:00pm Is it fair for your car salesman to get less compensation just because you couldn't qualify for a loan?
This is one of the downsides of pulling activities into the public realm. Arrangements that generally arise with a dynamic emergent order now become matters of public policy. Matters that should be none of my business (because that's how they improve) are charged with moral gravitas. Our silent, mundane, perpetual source of progress is overtaken by a tribal pissing contest.
Thursday, January 30, 2014
RDGP and NGDP
Market monetarists, who would have the Fed target an NGDP growth trajectory, often talk about the relationship between Nominal GDP (NGDP) and Real GDP (RGDP). In short, it's not a fixed-pie relationship, where real growth goes up when inflation goes down. It's not even a non-relationship, where they go up and down independently. In fact, under conditions where inflation is not excessive, higher inflation tends to come with higher real growth.
Here, I have graphed RGDP on a scatterplot with an inflation measure. What we can see here is that there appears to be some level of inflation - around 4% or so - above which the balance of positive and negative effects from inflation switches and becomes increasingly negative. This was the case from 1973 to 1982. When we combine all the periods since 1948, we can see the humped relationship.
Demographics are certainly putting a damper on aggregate growth, and the correlations run in all directions here. But, since 2009, the sideways movement in the Employment-Population Ratio has been about what one would predict, given the level of RGDP growth we have had. Where would we be now, if the Fed had kept a 4% inflation target instead of a 2% target? The nice thing about NGDP targeting is that they wouldn't have to make that distinction explicitly. If they had a 5% NGDP target, inflation would find its own level, and wage and bond markets would be able to clear more easily.
In the meantime, it's worth noting that having an inflation rate consistently below 2% may be just as bad a policy as having inflation around 6% or 7%. I don't see any reason to be afraid of 4% inflation, at least on occasion. What caused us to be so afraid of 4% inflation? What awful historical incident was triggered by 4% inflation?
Here, I have graphed RGDP on a scatterplot with an inflation measure. What we can see here is that there appears to be some level of inflation - around 4% or so - above which the balance of positive and negative effects from inflation switches and becomes increasingly negative. This was the case from 1973 to 1982. When we combine all the periods since 1948, we can see the humped relationship.
If we take out the period before 1973, which had more volatile GDP behavior, the relationship is even more clear:
In the meantime, it's worth noting that having an inflation rate consistently below 2% may be just as bad a policy as having inflation around 6% or 7%. I don't see any reason to be afraid of 4% inflation, at least on occasion. What caused us to be so afraid of 4% inflation? What awful historical incident was triggered by 4% inflation?
Wednesday, January 29, 2014
A Couple More Minimum Wage Regressions
I've done a couple more sets of regressions that take economic growth into account, and I have found very strong relationships. The strongest relationship uses all three trends from each episode (pre-MW, MW, and post-MW). It attributes a decrease of 3.6% in teen Employment-Population Ratio and 1.4% in total EPR to the implementation of the typical series of minimum wage increases. Results below the fold:
QE's and the end of the zero lower bound
Here is a graph that is a rough approximation of the date the market expects short term rates to escape the lower bound.
The date stabilized briefly, roughly coincident with QE2. But generally, over the past 5 years, until the beginning of QE3, that future date, like a carrot on a stick, just kept moving out in the future, with some noise in either direction.
I think we can possibly call Operation Twist a failure. It apparently didn't do anything to change the trajectory of expecations, but it saddled the Fed with a lot of duration risk that is now a cause of concern for the FOMC and some observers.
Here is a graph of the expected date of the first rate increase and the expected slope of the yield curve at that time:
The blue line (expected date of the rate hike) corresponds with the QE3 period in the graph above (it is roughly the inverse of that graph). We can see that all of the permanent increases in interest rates over the past year have been the result of an increase in the slope of the yield curve, not a change in the expected date of the rate increase.
I would expect the slope of the yield curve to slowly trend up to around 40 or 50 bp per quarter, and this would cause a moderate amount of continued increases in interest rates over the next year or so. (This is the typical slope coming out of a trough.)
I expect the date of the rate increase to arrive in the approximate time frame that the market expects. The question now is what happens as the Fed tapers. If some of the tail winds I am seeing in the labor market continue to play out, then we might see that date move up 6 months or so to late 2014. If the disinflationary pressures of the taper cause the same sort of retardation that the previous QE tapers caused, then rates could crash, and we could have some difficult long-term problems.
The Fed has consistently underestimated the strength of the labor market, and with a current forecast of 6.3% - 6.6% for the 4th quarter of 2014, short of a massive correction in the direction of the economy, they have underestimated it again. I hope this leads them to a dovish posture. If that expected date starts creeping out again, we've got some problems.
I think we can possibly call Operation Twist a failure. It apparently didn't do anything to change the trajectory of expecations, but it saddled the Fed with a lot of duration risk that is now a cause of concern for the FOMC and some observers.
Here is a graph of the expected date of the first rate increase and the expected slope of the yield curve at that time:
| Source: Authors calculations, based on daily prices of Eurodollars futures Slope (left scale, in bp), date of first rate hike (right scale, in quarters from 1Q 2013) |
The blue line (expected date of the rate hike) corresponds with the QE3 period in the graph above (it is roughly the inverse of that graph). We can see that all of the permanent increases in interest rates over the past year have been the result of an increase in the slope of the yield curve, not a change in the expected date of the rate increase.
I would expect the slope of the yield curve to slowly trend up to around 40 or 50 bp per quarter, and this would cause a moderate amount of continued increases in interest rates over the next year or so. (This is the typical slope coming out of a trough.)
I expect the date of the rate increase to arrive in the approximate time frame that the market expects. The question now is what happens as the Fed tapers. If some of the tail winds I am seeing in the labor market continue to play out, then we might see that date move up 6 months or so to late 2014. If the disinflationary pressures of the taper cause the same sort of retardation that the previous QE tapers caused, then rates could crash, and we could have some difficult long-term problems.
The Fed has consistently underestimated the strength of the labor market, and with a current forecast of 6.3% - 6.6% for the 4th quarter of 2014, short of a massive correction in the direction of the economy, they have underestimated it again. I hope this leads them to a dovish posture. If that expected date starts creeping out again, we've got some problems.
Tuesday, January 28, 2014
North Carolina FTW!
The results from North Carolina continue to be extremely positive. If this foretells the national experience, hold on to your hats, people, it's going to be a heck of a year.
This first graph is monthly changes, in thousands of people. This is not a cumulative graph, folks. The divergence in the employment and unemployment indicators is momentum. That means that each month is improving at a faster pace than the months before.
Below, I have updates of the graphs I had done, comparing the North Carolina stats to the national stats. The North Carolina unemployment rate is down a whopping 2% since Emergency Unemployment Insurance was terminated.
I still have some question about whether any of the labor movements before June, which weren't positive, might have been related to the policy. But, here's what I said two months ago:
Holy cow, look at this graph, of unusual movements in the North Carolina data, compared to the national data. LFP down about 0.2% and unemployment down more than 1% since the end of the policy. I need to start charging you people some serious cash-ola for this information.
Here are all the graphs of North Carolina compared to the national numbers.
Below, I have updates of the graphs I had done, comparing the North Carolina stats to the national stats. The North Carolina unemployment rate is down a whopping 2% since Emergency Unemployment Insurance was terminated.
I still have some question about whether any of the labor movements before June, which weren't positive, might have been related to the policy. But, here's what I said two months ago:
It looks plausible that the North Carolina experience will support both of my estimates that (1) unemployment is about 1% higher than it would be without EUI and that (2) LFP is slightly higher (less than 0.2%).
Here are all the graphs of North Carolina compared to the national numbers.
Policies are for identifying outsiders
A paper by Jeremy Greenwood, Nezih Guner, Georgi Kocharkov, and Cezar Santos outlines the overwhelming importance of assortive mating and female labor participation as causes of measured income inequality. (HT: Tyler Cowen). Comparing 2005 to 1960, they find that a very large cause of inequality is the trend for women to become more educated and to enter the labor force, and to marry men who have similar earning power. Essentially, they find that if you eliminate these cultural changes, the measured increases in inequality would disappear.
I have previously posted about how a large amount of household income variance is related to the number of earners in the household, and how much of the shift in inequality and median income levels is a result of having more one-earner and zero-earner households.
But, I think that the paper cited above is a great example to use to look at the implicit function of political policies. Here are two lists of possible solutions to the inequality issue:
List A:
More progressive taxation
Wage controls
Restrictions and mandates on employers
List B:
Restrictions on mate selection
Forced birth control or adoption for unmarried parents
Return to 1960 level of female education
Return to 1960 level of female labor force participation
Restrictions on number of earners per household
Forced marriages
I suspect that you have a sour reaction to list B. I know I do. I think we could all agree, though, that the List B solutions would, for the most part, have a very direct and potent effect on measured inequality. We could argue that some of those policies might not work so well in practice. But, some of them, if they were really implemented, would clearly improve measured household inequality.
Your reaction to List A is probably very positive compared to List B. These are commonly proposed solutions, and, in fact, they are solutions that have been implemented, at some scale. We could also argue that these policies don't usually work as well in practice as they do in theory, but a reasonable argument can be made that they can be somewhat effective at creating marginal improvements in measured inequality.
If we only had one goal, though - to reduce inequality - and no set of principles limiting our solutions, List B would be overwhelmingly more direct and effective.
A Presumption of Rights
Bryan Caplan recently commented on the tendency for public policy to be implemented indirectly. His conclusion is that citizens would see the moral trade-offs of policies more clearly if they were imposed directly, so policies are implemented through businesses and other focused agencies in order to obfuscate the moral and financial costs to the average citizen.
But, I think we need to take this a step farther than Bryan did. My sour reaction to List B could be self-interested, but I feel just as strongly about opposing the specific limits on female personal development as I do about the other List B proposals. I don't think self-interest is as operative here as is simply a basic notion of inalienable rights. You just can't prevent people from becoming educated or marrying whom they choose. Full stop.
So, there are two overriding influences on our policy constraints. Regarding List B, there is no plausible social outcome that would be bad enough for us to implement these policies. Regarding List A, there are a range of social outcomes that might plausibly lead to support for these proposals. In fact, going back to the paper's starting point in 1960, considering the complexity of social development, we could expect with some certainty that between then and now, some list of problems would arise that would lead reasonable people to call for these policies as a solution.
We can see that the inevitability of List A comes not from its effectiveness, but from its philosophical availability. Support for these policies is not a product of a search for solutions so much as it is an identification of social agents who can be reliably coerced without triggering a universal response of outrage. It's an identification of non-affiliates - factional outsiders - a stand against bourgeois dignity. This posture is a deep and foundational human tendency.
In Practice
I will close with a specific example of this process at work. Last year, the New Mexico Supreme Court ruled that a photography business could be forced to photograph a gay wedding. I would love to live in a country where discrimination of all types wasn't common. But, note what solutions to this problem are not on the table. You can still refuse to hire a gay photographer. You can refuse to work for a gay photographer. It seems obvious to me that more damage is done because of those two perfectly legal sources of discrimination than because gay couples might have a few less photographers to choose from when they marry.
Note also, that the photographer argued her case based on free speech. The right of freedom of association, if you happen to be engaged in lowly, filthy commerce, is so out of favor in the Land of the Free, that it would damage your case to assert it.
That ruling was explicitly about the expansion of civil rights. But, more accurately, it was about precisely the opposite.
(edit: Please read the above paragraph carefully. I do not support bigotry. My point is that there are large areas in our personal lives where we demand the right to be bigots. We don't say this explicitly. But, in marriage, for instance, while a consensus of the population is against blatantly bigoted controls on marriage, we all take for granted that our own personal decisions can be as idiosyncratic and prejudiced as we like. We would stand for no less. I am attempting to make this distinction between our personal expectations and the controls we accept on commercial decisions explicit, so that we can think through the prejudices embedded in our own principles.)
Pride and Prejudice
Jane Austen didn't become famous by writing novels about aspirational young women winning the right to entrust their business ventures to the workers their hearts chose. But talk about assortive mating! Imagine the emotional reaction you would have to a Jane Austen story if the characters were as prejudiced with the hiring practices of their estates as they were in choosing their mates. That sort of discrimination would have been a black mark, and it would lessen our fondness for the characters. But, how we delight when they marry well.
Outrage and coercion are not about solutions. They are about identifying outsiders and activities that we exempt from the protection of our principles.
I have previously posted about how a large amount of household income variance is related to the number of earners in the household, and how much of the shift in inequality and median income levels is a result of having more one-earner and zero-earner households.
But, I think that the paper cited above is a great example to use to look at the implicit function of political policies. Here are two lists of possible solutions to the inequality issue:
List A:
More progressive taxation
Wage controls
Restrictions and mandates on employers
List B:
Restrictions on mate selection
Forced birth control or adoption for unmarried parents
Return to 1960 level of female education
Return to 1960 level of female labor force participation
Restrictions on number of earners per household
Forced marriages
I suspect that you have a sour reaction to list B. I know I do. I think we could all agree, though, that the List B solutions would, for the most part, have a very direct and potent effect on measured inequality. We could argue that some of those policies might not work so well in practice. But, some of them, if they were really implemented, would clearly improve measured household inequality.
Your reaction to List A is probably very positive compared to List B. These are commonly proposed solutions, and, in fact, they are solutions that have been implemented, at some scale. We could also argue that these policies don't usually work as well in practice as they do in theory, but a reasonable argument can be made that they can be somewhat effective at creating marginal improvements in measured inequality.
If we only had one goal, though - to reduce inequality - and no set of principles limiting our solutions, List B would be overwhelmingly more direct and effective.
A Presumption of Rights
Bryan Caplan recently commented on the tendency for public policy to be implemented indirectly. His conclusion is that citizens would see the moral trade-offs of policies more clearly if they were imposed directly, so policies are implemented through businesses and other focused agencies in order to obfuscate the moral and financial costs to the average citizen.
But, I think we need to take this a step farther than Bryan did. My sour reaction to List B could be self-interested, but I feel just as strongly about opposing the specific limits on female personal development as I do about the other List B proposals. I don't think self-interest is as operative here as is simply a basic notion of inalienable rights. You just can't prevent people from becoming educated or marrying whom they choose. Full stop.
So, there are two overriding influences on our policy constraints. Regarding List B, there is no plausible social outcome that would be bad enough for us to implement these policies. Regarding List A, there are a range of social outcomes that might plausibly lead to support for these proposals. In fact, going back to the paper's starting point in 1960, considering the complexity of social development, we could expect with some certainty that between then and now, some list of problems would arise that would lead reasonable people to call for these policies as a solution.
We can see that the inevitability of List A comes not from its effectiveness, but from its philosophical availability. Support for these policies is not a product of a search for solutions so much as it is an identification of social agents who can be reliably coerced without triggering a universal response of outrage. It's an identification of non-affiliates - factional outsiders - a stand against bourgeois dignity. This posture is a deep and foundational human tendency.
In Practice
I will close with a specific example of this process at work. Last year, the New Mexico Supreme Court ruled that a photography business could be forced to photograph a gay wedding. I would love to live in a country where discrimination of all types wasn't common. But, note what solutions to this problem are not on the table. You can still refuse to hire a gay photographer. You can refuse to work for a gay photographer. It seems obvious to me that more damage is done because of those two perfectly legal sources of discrimination than because gay couples might have a few less photographers to choose from when they marry.
Note also, that the photographer argued her case based on free speech. The right of freedom of association, if you happen to be engaged in lowly, filthy commerce, is so out of favor in the Land of the Free, that it would damage your case to assert it.
That ruling was explicitly about the expansion of civil rights. But, more accurately, it was about precisely the opposite.
(edit: Please read the above paragraph carefully. I do not support bigotry. My point is that there are large areas in our personal lives where we demand the right to be bigots. We don't say this explicitly. But, in marriage, for instance, while a consensus of the population is against blatantly bigoted controls on marriage, we all take for granted that our own personal decisions can be as idiosyncratic and prejudiced as we like. We would stand for no less. I am attempting to make this distinction between our personal expectations and the controls we accept on commercial decisions explicit, so that we can think through the prejudices embedded in our own principles.)
Pride and Prejudice
Jane Austen didn't become famous by writing novels about aspirational young women winning the right to entrust their business ventures to the workers their hearts chose. But talk about assortive mating! Imagine the emotional reaction you would have to a Jane Austen story if the characters were as prejudiced with the hiring practices of their estates as they were in choosing their mates. That sort of discrimination would have been a black mark, and it would lessen our fondness for the characters. But, how we delight when they marry well.
Outrage and coercion are not about solutions. They are about identifying outsiders and activities that we exempt from the protection of our principles.
Subscribe to:
Posts (Atom)