
Friday, January 10, 2014
JOLTS data as a leading indicator
It will be interesting to see how well JOLTS data portend the next downturn. They seemed to be a leading indicator for the last downturn, but I wonder if that is typical, or if it was a product of the context leading up to the downturn. Would hires, quits, and openings have shifted down so early in the absence of the reversal of home prices and the implementation of minimum wage hikes?

Thursday, January 9, 2014
Is Extended Unemployment Insurance Progressive or Stimulative?
This is kind of half-done, but I hope it might be interesting enough for somebody. The idea I was working on was that, as the number of weeks of unemployment insurance (UI) increases, the policy becomes less progressive, because unemployment duration increases with age. But, to take a stab at this, I would need more detailed data about income, by both education and age, that I don't see available anywhere. (edit: I did find some income data, in a PS below.)
But, I can at least get a good idea of how age relates to UI. First, I constructed estimated unemployment durations by age, using average durations for each age group and unemployment numbers (for these graphs, I used May 2013):

For young workers, there is a lot of unemployment churn, but most workers are re-employed in a few weeks. For older workers, there is much less churn, but workers tend to take longer to become re-employed. This is reflected in the level and slope of the lines in this chart.
From this, we can estimate the average age of unemployed workers at any given duration of unemployment. As can be seen in the following graph, the average age of workers who have just become unemployed is about 32 years. But, workers who have been unemployed for more than 87 weeks average more than 40 years old.
 I had previously seen research that suggested, at least for older workers, workers with more education tend to have longer unemployment durations. But, this chart, from the Cleveland Fed, shows little difference in durations between different educational categories:

My hunch is that educational effects on unemployment duration change with age, so that young workers with more education have shorter unemployment durations and old workers with more education have longer unemployment durations. But, I haven't found any available data to confirm that. (edit: That pattern could explain the convergence of the durations of the education levels as baby boomers have aged, which is shown in the graph.)
In any case, the point to consider here is that, while the first few weeks of UI are certainly a progressive redistribution, as UI is extended to a longer duration, the progressivity of the distribution would decline. If the average worker who has been unemployed for 70 or 80 weeks is about 40 years old, with above average education, it is possible that the beneficiaries at the long end of emergency UI tend to be workers who were earning above median wages.
In addition, as the age and financial condition of EUI beneficiaries increases with the extension of benefits, the supposed stimulative effects of the program would also diminish, since the benefits would be likely to replace savings. In fact, even if we accept the notion that benefits redistributed to lower income households will benefit the economy because they will be more likely to be used in consumption, the application of that idea to EUI is suspect. Except for the poorest recipients, I would expect most households to react to unemployment by consuming with dissaving (through debt accumulation or reductions in savings), which would be replenished or repaid with previously unplanned future earnings. So, a good portion of EUI would simply replace savings today, and would decrease future production because of the income effect.
This problem would limit the supposed stimulative effects of EUI increasingly as it is extended to longer durations. The assertion of the stimulative effect of EUI calls for empirical support, even if the idea is accepted on its own terms.
PS. I did find some education and income data at the US Census Bureau, here.
I made some simplifying assumptions - that unemployment duration is the same for all education levels within each age group, and that the relative unemployment rate of each education group is the same for all age groups. This produced a single mean income level for each age group that remained stable at all unemployment durations, so that the income level is just a product of the number of unemployed workers of each age. I realize that this is a lot of simplification, but it probably gives a pretty good first estimate for my purposes here.
Of course, the income figure reflects the income these workers would expect to receive when they are employed. These income figures are based on individuals, not households.
Here is the result:
The mean income (when employed) of unemployed workers rises, much as the average age rises, with duration of unemployment. But, if my simplifications and estimates are somewhat accurate, the mean expected income of unemployed individuals begins at just over $30,000, and as unemployment duration rises toward 99 weeks, starts to level off around $40,000.
So, while the average working income of beneficiaries does appear to rise as EUI is extended to longer periods, it doesn't appear to reach the level of the mean income of the average US individual who is working.

But, I can at least get a good idea of how age relates to UI. First, I constructed estimated unemployment durations by age, using average durations for each age group and unemployment numbers (for these graphs, I used May 2013):
For young workers, there is a lot of unemployment churn, but most workers are re-employed in a few weeks. For older workers, there is much less churn, but workers tend to take longer to become re-employed. This is reflected in the level and slope of the lines in this chart.
From this, we can estimate the average age of unemployed workers at any given duration of unemployment. As can be seen in the following graph, the average age of workers who have just become unemployed is about 32 years. But, workers who have been unemployed for more than 87 weeks average more than 40 years old.
I had previously seen research that suggested, at least for older workers, workers with more education tend to have longer unemployment durations. But, this chart, from the Cleveland Fed, shows little difference in durations between different educational categories:My hunch is that educational effects on unemployment duration change with age, so that young workers with more education have shorter unemployment durations and old workers with more education have longer unemployment durations. But, I haven't found any available data to confirm that. (edit: That pattern could explain the convergence of the durations of the education levels as baby boomers have aged, which is shown in the graph.)
In any case, the point to consider here is that, while the first few weeks of UI are certainly a progressive redistribution, as UI is extended to a longer duration, the progressivity of the distribution would decline. If the average worker who has been unemployed for 70 or 80 weeks is about 40 years old, with above average education,
In addition, as the age and financial condition of EUI beneficiaries increases with the extension of benefits, the supposed stimulative effects of the program would also diminish, since the benefits would be likely to replace savings. In fact, even if we accept the notion that benefits redistributed to lower income households will benefit the economy because they will be more likely to be used in consumption, the application of that idea to EUI is suspect. Except for the poorest recipients, I would expect most households to react to unemployment by consuming with dissaving (through debt accumulation or reductions in savings), which would be replenished or repaid with previously unplanned future earnings. So, a good portion of EUI would simply replace savings today, and would decrease future production because of the income effect.
This problem would limit the supposed stimulative effects of EUI increasingly as it is extended to longer durations. The assertion of the stimulative effect of EUI calls for empirical support, even if the idea is accepted on its own terms.
PS. I did find some education and income data at the US Census Bureau, here.
I made some simplifying assumptions - that unemployment duration is the same for all education levels within each age group, and that the relative unemployment rate of each education group is the same for all age groups. This produced a single mean income level for each age group that remained stable at all unemployment durations, so that the income level is just a product of the number of unemployed workers of each age. I realize that this is a lot of simplification, but it probably gives a pretty good first estimate for my purposes here.
Of course, the income figure reflects the income these workers would expect to receive when they are employed. These income figures are based on individuals, not households.
Here is the result:
The mean income (when employed) of unemployed workers rises, much as the average age rises, with duration of unemployment. But, if my simplifications and estimates are somewhat accurate, the mean expected income of unemployed individuals begins at just over $30,000, and as unemployment duration rises toward 99 weeks, starts to level off around $40,000.
So, while the average working income of beneficiaries does appear to rise as EUI is extended to longer periods, it doesn't appear to reach the level of the mean income of the average US individual who is working.
Labor Force Participation by Education
Here's an interesting graph from the Cleveland Fed:
 I know I'm kind of beating a dead horse here, but each new chart I see of LFP seems to show the same pattern. Everyone talks as if cyclical factors are the overwhelming issue in LFP, yet again and again, when we slice up the labor force, we find that other factors are so much more important that it's hard to even see the cyclical effects.
There is some cyclical effect, and it can be visually magnified by showing aggregate LFP over a short time frame with a very tight scale on the y-axis.
But, whether we categorize workers by age or education level, these factors are many times more significant than cyclical effects.
And, here again with education levels, as with age groups, we find this long term, very linear down trend across almost all categories of a little more than 1% per decade. The decline is slightly steeper here compared to the age group trends, and it is accelerating downward, because the aging issue is pulling the levels of all of the education categories down.
The most interesting item here is that the one category of worker where LFP has been rising over the long term is the "Less than High School" category.
Once again, this just doesn't look to me like a LFP trend that is falling because workers at the lower tiers of the labor force are quitting out of desperation. There are deeper issues working here - either some labor market disruptions such as rising health care costs, or simply the choices of a wealthier society - which may not have or need an obvious solution.
There is some cyclical effect, and it can be visually magnified by showing aggregate LFP over a short time frame with a very tight scale on the y-axis.
But, whether we categorize workers by age or education level, these factors are many times more significant than cyclical effects.
And, here again with education levels, as with age groups, we find this long term, very linear down trend across almost all categories of a little more than 1% per decade. The decline is slightly steeper here compared to the age group trends, and it is accelerating downward, because the aging issue is pulling the levels of all of the education categories down.
The most interesting item here is that the one category of worker where LFP has been rising over the long term is the "Less than High School" category.
Once again, this just doesn't look to me like a LFP trend that is falling because workers at the lower tiers of the labor force are quitting out of desperation. There are deeper issues working here - either some labor market disruptions such as rising health care costs, or simply the choices of a wealthier society - which may not have or need an obvious solution.
Monday, January 6, 2014
A Great Quip
"Markets can remain solvent longer than you can remain irrational."
From JC Parets (All Star Charts), via Joshua Brown at thereformedbroker.com via Jeff Miller at "A Dash of Insight".
Well played, Mr. Parets.
From JC Parets (All Star Charts), via Joshua Brown at thereformedbroker.com via Jeff Miller at "A Dash of Insight".
Well played, Mr. Parets.
Monday, December 30, 2013
Abundance Requires Real-Time Knowledge of Scarcity
Most politics consists of factions talking past one another in a process of loyalty signaling. Obamacare is no exception.
Supporters have defended the law by describing individuals who have qualified for health insurance through the exchanges at lower prices than they had previously paid. This defense is effective within the progressive paradigm, which is built around the goal of transferring resources to affiliates by taking it from non-affiliates, via the state, with the goal of imposing justice.
Please allow me to talk past those defenders in support of a different paradigm.
Obamacare as an expression of progressivism seems especially vulgar to me. The law is such a Rube Goldberg device for the delivery of health care, there is no way of knowing what groups of citizens end up paying and who will benefit. In that way, I think it fails, even as a progressive policy. As a first order effect, it does appear that fines and penalties are imposed on businesses, especially on larger businesses, and subsidies are paid to families, pro-rated based on income, and this does reflect a typical line-up of progressive affiliations. But even before we leave the first order effects, there appear to be arbitrary transfers from young people to older people, and many instances where people across the socio-economic spectrum are losing coverage based on some arbitrary combination of the law's requirements.
Beyond the first order outcomes, there appear to be penalties imposed on employers for hiring the poor and incentives for employers to drop or change coverage in any number of arbitrary ways. The only things we can say for certain about the law at this point are that (1) it creates a non-transparent method for state-direction in the disposition of health care and (2) it obfuscates the cost of that disposition.
Abundance is not a naturally occurring outcome. The natural human condition is one of poverty or of temporary abundance quickly nullified by Malthusian reality. We only escaped that inevitability when some miraculous combination of cultural and political developments created an economic context roughly described as:
So, if we want to rid ourselves of abundance, a very effective first step would be to obfuscate sources of scarcity and hide costs. Public policy has been engaged in this for the better part of a century, most notably in education and health care, possibly never more so than in Obamacare (excepting the NIRA). And, consumption of these services is understandably enveloping more and more of our productive capacity.
When I hear the above defense of Obamacare, I hear someone saying that what the law has accomplished so far is the destruction of information about scarcity. It is a fetishization of egalitarianism and of healthcare. The vast amount of that destruction could be avoided by simply handing out cash. The problem is that, in many cases, if households received $10,000 in cash instead of a health insurance subsidy, they would choose to spend it on something other than health insurance. That would be informational, but we have a hear no evil, see no evil policy. We don't want information. We want our political fetishes to be stroked.
A national income would seem to be such an improvement over this mess. If every household started with a credit of some $10,000's - whatever we deemed appropriate as a minimum income - and then paid a flat income tax rate from the first dollar earned, then we could stop beating abundance down with all of these obfuscations of scarcity information.
This policy wouldn't end politics. The optimal policy would leave us with some deserving and unlucky citizens who need more and some undeserving parasitical citizens who will be taking advantage of the system - in fact, we'd all probably find a little bit of ourselves in both columns. We would be able to fight over the weight we should assign to those individual outcomes in managing transfers and determining the appropriate level of generosity. And we would all want to express our political power over recipients by judging the ways they spend or don't spend their proceeds, so we will always be tempted to re-impose policies that undermine the individual liberty that is necessary for information about scarcity to be disseminated. That temptation is so strong a part of human nature, I don't see how we will ever escape it.
Therefore, I'm not completely confident in the success of a national income policy. Reforms in the 1990's replaced some former welfare policies with policies that lowered the net de facto tax rate on poor workers and removed some of the debilitating disincentives to work. These were unalloyed improvements in the system of social support. This led to a situation where more adult workers are taking low-paying jobs, because they can take those jobs without giving up all of their income supplements. That was the point of the reform. But, now, some people point to these workers and interpret the situation as corporate welfare, as if the employers are pocketing the public subsidies.
The progressive foundational tendency to view the population as collections of people with different levels of power which we need to help equalize leads to a view of prices resulting from a power imbalance between negotiating parties. A worldview that treats corporations in general as monopolists naturally discounts the informational value of prices. This is the foundation for support of minimum wage increases. A model that denies any employment loss from the minimum wage is a model that attributes wage levels to powerful monopsonist employers. I am afraid that there will always be a political force undermining the important informational function of prices.
The problem is that lack of bargaining power is a product of lack of productivity, so the empirical distinction that leads people off-track is a subtle one - too subtle for a counterargument to be persuasive. If Malcolm Gladwell and I both walked into a publisher's office, he would be able to negotiate a much more lucrative contract than I would. He would be a lot more powerful than I would be in that negotiation. He would have power because he knows how to write books that a lot of people will buy. His negotiating power is information. It tells us something about the value publishers expect his books to create. If we collect anecdotes about evidence of undeserved or abused power, and we use those experiences as a reason to disarm all negotiating power, we are destroying information, and thus, abundance.
I would note, in addition, that the sources of power imbalances beyond informational signals of value are much, much smaller than they are made out to be. Take Wal-Mart as a typical example of the large, powerful corporation that takes advantage of a power imbalance to hire workers at low wages (so the story goes). We have a similar imbalance of power as Wal-Mart customers. Do you feel overwhelmed by the negotiating power of Wal-Mart when you shop there? Are you beaten down and forced to pay above market rates for diapers and paper towels because of the power imbalance? On the contrary. In fact, if you pick up a $12 package of paper towels at Wal-Mart and tell the check-out clerk that you saw them at KMart for $9, the clerk will most likely deduct $3 without hesitation. Power imbalances are much less important in the marketplace than what they are given credit for.
PS. Paul Krugman gives a good example of how this paradigm, which begins with a virtuous intuition to take the side of the least powerful, can so quickly become bigotry:
Take Dr. Krugman's comment above. Now, subtly switch the identities of his narrative. Imagine it's 2009, you need your house painted, and house painters are dying for work. You can really feel around for a low ball price from a good painter. So, in this version of the story, you are the "employer" and small businesspeople are the "workers" in a poor economy. Everything in that narrative is still basically true.
So, as a general proposition, in the market for home maintenance, is it not a matter of mutual consent? Is it basically a power relationship? Do legal restraints on your ability to freely contract with home painters help the home painter? Do they help you? Should home painters belong to a cartel that limits your choice of provider and price? Home painters are always very easy to replace. They clearly need you more than you need them. And, were you delighted that the economy was in the stinker, so you could get such a great deal?
The truth is, in that specific case, you would have been happy to get such a service at such basement level prices. But, there's no doubt that you would have traded that cheap service for a more prosperous community in a heartbeat.
When we set up paradigms that lock certain parties into the role of "other", we withdraw an important part of the process of engaging and judging, and we become opponents of truth-seeking, in, frankly, a rather ugly way. We make a mistake if we believe that this problem is limited to contexts where the other is a race, or an ethnicity, or a sexual identity.
Supporters have defended the law by describing individuals who have qualified for health insurance through the exchanges at lower prices than they had previously paid. This defense is effective within the progressive paradigm, which is built around the goal of transferring resources to affiliates by taking it from non-affiliates, via the state, with the goal of imposing justice.
Please allow me to talk past those defenders in support of a different paradigm.
Obamacare as an expression of progressivism seems especially vulgar to me. The law is such a Rube Goldberg device for the delivery of health care, there is no way of knowing what groups of citizens end up paying and who will benefit. In that way, I think it fails, even as a progressive policy. As a first order effect, it does appear that fines and penalties are imposed on businesses, especially on larger businesses, and subsidies are paid to families, pro-rated based on income, and this does reflect a typical line-up of progressive affiliations. But even before we leave the first order effects, there appear to be arbitrary transfers from young people to older people, and many instances where people across the socio-economic spectrum are losing coverage based on some arbitrary combination of the law's requirements.
Beyond the first order outcomes, there appear to be penalties imposed on employers for hiring the poor and incentives for employers to drop or change coverage in any number of arbitrary ways. The only things we can say for certain about the law at this point are that (1) it creates a non-transparent method for state-direction in the disposition of health care and (2) it obfuscates the cost of that disposition.
Abundance is not a naturally occurring outcome. The natural human condition is one of poverty or of temporary abundance quickly nullified by Malthusian reality. We only escaped that inevitability when some miraculous combination of cultural and political developments created an economic context roughly described as:
From each according to his need, to each according to his ability.This means that the measures of need and ability are distilled through the individual; disposition and costs are personal and transparent. This is the only sustainable source of abundance. Obviously charity complements this ethic, by fulfilling needs left unmet. But, the engine of abundance requires charity work to be parallel to this ethic - not in opposition to it. (The corollary - From each according to his ability, to each according to his need - describes both (1) as-yet-unattained utopia and (2) slavery.)
So, if we want to rid ourselves of abundance, a very effective first step would be to obfuscate sources of scarcity and hide costs. Public policy has been engaged in this for the better part of a century, most notably in education and health care, possibly never more so than in Obamacare (excepting the NIRA). And, consumption of these services is understandably enveloping more and more of our productive capacity.
When I hear the above defense of Obamacare, I hear someone saying that what the law has accomplished so far is the destruction of information about scarcity. It is a fetishization of egalitarianism and of healthcare. The vast amount of that destruction could be avoided by simply handing out cash. The problem is that, in many cases, if households received $10,000 in cash instead of a health insurance subsidy, they would choose to spend it on something other than health insurance. That would be informational, but we have a hear no evil, see no evil policy. We don't want information. We want our political fetishes to be stroked.
A national income would seem to be such an improvement over this mess. If every household started with a credit of some $10,000's - whatever we deemed appropriate as a minimum income - and then paid a flat income tax rate from the first dollar earned, then we could stop beating abundance down with all of these obfuscations of scarcity information.
This policy wouldn't end politics. The optimal policy would leave us with some deserving and unlucky citizens who need more and some undeserving parasitical citizens who will be taking advantage of the system - in fact, we'd all probably find a little bit of ourselves in both columns. We would be able to fight over the weight we should assign to those individual outcomes in managing transfers and determining the appropriate level of generosity. And we would all want to express our political power over recipients by judging the ways they spend or don't spend their proceeds, so we will always be tempted to re-impose policies that undermine the individual liberty that is necessary for information about scarcity to be disseminated. That temptation is so strong a part of human nature, I don't see how we will ever escape it.
Therefore, I'm not completely confident in the success of a national income policy. Reforms in the 1990's replaced some former welfare policies with policies that lowered the net de facto tax rate on poor workers and removed some of the debilitating disincentives to work. These were unalloyed improvements in the system of social support. This led to a situation where more adult workers are taking low-paying jobs, because they can take those jobs without giving up all of their income supplements. That was the point of the reform. But, now, some people point to these workers and interpret the situation as corporate welfare, as if the employers are pocketing the public subsidies.
The progressive foundational tendency to view the population as collections of people with different levels of power which we need to help equalize leads to a view of prices resulting from a power imbalance between negotiating parties. A worldview that treats corporations in general as monopolists naturally discounts the informational value of prices. This is the foundation for support of minimum wage increases. A model that denies any employment loss from the minimum wage is a model that attributes wage levels to powerful monopsonist employers. I am afraid that there will always be a political force undermining the important informational function of prices.
The problem is that lack of bargaining power is a product of lack of productivity, so the empirical distinction that leads people off-track is a subtle one - too subtle for a counterargument to be persuasive. If Malcolm Gladwell and I both walked into a publisher's office, he would be able to negotiate a much more lucrative contract than I would. He would be a lot more powerful than I would be in that negotiation. He would have power because he knows how to write books that a lot of people will buy. His negotiating power is information. It tells us something about the value publishers expect his books to create. If we collect anecdotes about evidence of undeserved or abused power, and we use those experiences as a reason to disarm all negotiating power, we are destroying information, and thus, abundance.
I would note, in addition, that the sources of power imbalances beyond informational signals of value are much, much smaller than they are made out to be. Take Wal-Mart as a typical example of the large, powerful corporation that takes advantage of a power imbalance to hire workers at low wages (so the story goes). We have a similar imbalance of power as Wal-Mart customers. Do you feel overwhelmed by the negotiating power of Wal-Mart when you shop there? Are you beaten down and forced to pay above market rates for diapers and paper towels because of the power imbalance? On the contrary. In fact, if you pick up a $12 package of paper towels at Wal-Mart and tell the check-out clerk that you saw them at KMart for $9, the clerk will most likely deduct $3 without hesitation. Power imbalances are much less important in the marketplace than what they are given credit for.
PS. Paul Krugman gives a good example of how this paradigm, which begins with a virtuous intuition to take the side of the least powerful, can so quickly become bigotry:
Now, you may believe that employment is a market relationship like any other — there’s a buyer and a seller, and it’s just a matter of mutual consent. You may also believe in Santa Claus. The truth is that employment is, in many though not all cases, a power relationship. In good economic times, or where workers’ position is protected by legal restraints and/or strong unions, that relationship may be relatively symmetric. In times like these, it’s hugely asymmetric: employers and employees alike know that workers are easy to replace, lost jobs very hard to replace.I've mentioned before how bigoted thinking can very innocently arise from the innocent human quest for ideals (especially when our worldview feeds on a selective denial of scarcity). Advocacy lends itself to us-vs.-them thinking, and it is very hard to maintain advocacy in large groups without accruing some bigoted tendencies.
And may I suggest that employers, although they’ll never say so in public, like this situation? That is, there’s a significant upside to them from the still-weak economy.
Take Dr. Krugman's comment above. Now, subtly switch the identities of his narrative. Imagine it's 2009, you need your house painted, and house painters are dying for work. You can really feel around for a low ball price from a good painter. So, in this version of the story, you are the "employer" and small businesspeople are the "workers" in a poor economy. Everything in that narrative is still basically true.
So, as a general proposition, in the market for home maintenance, is it not a matter of mutual consent? Is it basically a power relationship? Do legal restraints on your ability to freely contract with home painters help the home painter? Do they help you? Should home painters belong to a cartel that limits your choice of provider and price? Home painters are always very easy to replace. They clearly need you more than you need them. And, were you delighted that the economy was in the stinker, so you could get such a great deal?
The truth is, in that specific case, you would have been happy to get such a service at such basement level prices. But, there's no doubt that you would have traded that cheap service for a more prosperous community in a heartbeat.
When we set up paradigms that lock certain parties into the role of "other", we withdraw an important part of the process of engaging and judging, and we become opponents of truth-seeking, in, frankly, a rather ugly way. We make a mistake if we believe that this problem is limited to contexts where the other is a race, or an ethnicity, or a sexual identity.
Wednesday, December 25, 2013
What Quits Are Telling Us
Demographic Adjustments to Quits
It occurred to me that another area where demographics (the baby boomers) would be skewing a statistical trend is the JOLTS data. Older workers have longer durations of unemployment and lower unemployment rates, which suggests that older workers tend to have much lower employment churn than younger workers. This should mean that, all else equal, current quit rates should be lower than we might have seen in earlier time periods.
 JOLTS data doesn't include age information, but by using age-specific unemployment and unemployment duration data, I have been able to infer the quit rates of each age group. In order to make this inference, I need to assume that the distribution of unemployment durations and the proportion of separations that are quits are fairly uniform among age groups. These assumptions appear to be reasonable. Here is a comparison of actual quits to the estimated quits that my age-specific model produces:
 Now that I have an age-specific model, I can adjust the quits data for changes in age distribution. This graph compares actual quits to the quits we might be seeing if age demographics had remained as they were in December 2000, when JOLTS data started:
This is not quite as stark a difference as I had expected. But, demographics is creating a sizable downward shift in the quit rate of a little more than 200,000 quits per month, or about 0.15%, compared to what we would likely see with a younger labor force.
 Whereas the previous graph showed Quits with labor force age distribution held equal to December 2000, this graph shows Quits with everything else held equal and only labor force age distribution changing. This gives us a kind of full-employment demographic trend line for Quits. Again, there is a small drop in expected quits, though not as much as we see from demographic effects on the labor force participation rate.
Quits Compared to the Unemployment Rate
So, demographics are probably skewing labor churn down a little bit, but the basic narrative from quits isn't overwhelmingly changed by it. In either case, we are roughly back to the nadir of the quits rate in the previous recession. We do need to keep in mind, though, that the previous recession was pretty shallow in terms of labor disruptions. Unemployment topped out at 6.3%. (I've reviewed in many previous posts why a declining labor force does not negate this fact.) So, while quits look weak in absolute terms, they are quite strong in relation to the unemployment rate. Quits have recovered to the same level they were in 2003 when the unemployment rate was only 6%.
As I have discussed before, recent minimum wage hikes and Emergency Unemployment Insurance (EUI) may have inflated the current unemployment rate, currently by around 1 1/2%. That would leave an unemployment rate of 5.5% related to non-MW and non-EUI factors. If we think about the effect of these legislative policies on quits, this could explain an unexpectedly strong quits rate. Low-wage workers who are legislatively priced out of labor markets and workers with extra incentives for extending their duration of unemployment would provide less competition to quitting workers. So, if my estimates are somewhat accurate, we would expect that last 1 1/2% worth of unemployed workers to exert less downward pressure on the quits rate, although they would still exert some.
All in all, I would say that the quits data makes me more confident about my estimates regarding the causes and level of current unemployment, and their effect on the labor market.
Here is a scatter graph of the quits rate over time compared to the unemployment rate:

The quits rate compared to the unemployment rate (in blue) looks to me like it has been following a pretty stable relationship. If I adjust quits for demographic effects (the red line), quits look especially strong coming out of the deepest point of the recent recession. If I adjust quits for demographics and also adjust unemployment for the distortions caused by MW and EUI (the purple line), then the relationship is similar to the relationship that we see without any adjustments. This could be a coincidence, or it could mean that my estimates of structural distortions of Quits and Unemployment are both fairly accurate, or it could mean that my estimates are both similarly inaccurate.
In all three cases, I don't see any evidence of an especially weak quits rate. In the time series above, the trend in growth rate of quits does appear to be lower in the current recession than it had been in the previous recession, but I suspect that this has to do with the inverse relationship between quits rates and the unemployment rate. This will only be answered with new data as the unemployment rate drops further. Quits might actually accelerate in 2014, which would be another tailwind for markets next year. Regardless of whether we use the raw labor numbers or my adjusted ones, the Quits rate looks pretty normal, even a little strong, compared to the trend that would smoothly lead Quits back to normal recovery levels.
This may be a case where the demographic adjustment is important. The unadjusted quits data may not look as strong as quits in the previous recovery, due to the older labor force. This may be one of many indicators where a bullish cyclical signal will be retarded by demographic effects.
Forgetting Half of Supply and Demand
I think this is another context where analysts ignore the role and the power of labor supply as an influence on the labor market. There are two factors pressing downward on the Quits rate.
One is a dearth of labor demand, signaled through an elevated unemployment level. This is the influence typically cited. But, this is only half the story.
The other influence is the aging of the labor force. Here, it is the relatively powerful position of labor suppliers that is pushing quits down. Older workers have less churn because they have lower unemployment rates and longer unemployment durations. This is the case because they have more control over their work, more seniority, more income and wealth, less to gain from a career shift, and more frictions in job searching because they tend to have more specialized and senior positions.
The demographic influence isn't huge, in absolute numbers, but if we compare where quits are now, at about 2350 per month, to where we would expect them to be as we neared full employment, around 2800 per month, the supply factor and the demand factor each seem to be contributing about 50% of the difference.
This is one more case where the tendency to view labor markets as if laborers are powerless causes commentators to come to easy conclusions about these issues too quickly.
It occurred to me that another area where demographics (the baby boomers) would be skewing a statistical trend is the JOLTS data. Older workers have longer durations of unemployment and lower unemployment rates, which suggests that older workers tend to have much lower employment churn than younger workers. This should mean that, all else equal, current quit rates should be lower than we might have seen in earlier time periods.

 Now that I have an age-specific model, I can adjust the quits data for changes in age distribution. This graph compares actual quits to the quits we might be seeing if age demographics had remained as they were in December 2000, when JOLTS data started:
This is not quite as stark a difference as I had expected. But, demographics is creating a sizable downward shift in the quit rate of a little more than 200,000 quits per month, or about 0.15%, compared to what we would likely see with a younger labor force.
 Whereas the previous graph showed Quits with labor force age distribution held equal to December 2000, this graph shows Quits with everything else held equal and only labor force age distribution changing. This gives us a kind of full-employment demographic trend line for Quits. Again, there is a small drop in expected quits, though not as much as we see from demographic effects on the labor force participation rate.
Quits Compared to the Unemployment Rate
So, demographics are probably skewing labor churn down a little bit, but the basic narrative from quits isn't overwhelmingly changed by it. In either case, we are roughly back to the nadir of the quits rate in the previous recession. We do need to keep in mind, though, that the previous recession was pretty shallow in terms of labor disruptions. Unemployment topped out at 6.3%. (I've reviewed in many previous posts why a declining labor force does not negate this fact.) So, while quits look weak in absolute terms, they are quite strong in relation to the unemployment rate. Quits have recovered to the same level they were in 2003 when the unemployment rate was only 6%.
As I have discussed before, recent minimum wage hikes and Emergency Unemployment Insurance (EUI) may have inflated the current unemployment rate, currently by around 1 1/2%. That would leave an unemployment rate of 5.5% related to non-MW and non-EUI factors. If we think about the effect of these legislative policies on quits, this could explain an unexpectedly strong quits rate. Low-wage workers who are legislatively priced out of labor markets and workers with extra incentives for extending their duration of unemployment would provide less competition to quitting workers. So, if my estimates are somewhat accurate, we would expect that last 1 1/2% worth of unemployed workers to exert less downward pressure on the quits rate, although they would still exert some.
All in all, I would say that the quits data makes me more confident about my estimates regarding the causes and level of current unemployment, and their effect on the labor market.
Here is a scatter graph of the quits rate over time compared to the unemployment rate:

The quits rate compared to the unemployment rate (in blue) looks to me like it has been following a pretty stable relationship. If I adjust quits for demographic effects (the red line), quits look especially strong coming out of the deepest point of the recent recession. If I adjust quits for demographics and also adjust unemployment for the distortions caused by MW and EUI (the purple line), then the relationship is similar to the relationship that we see without any adjustments. This could be a coincidence, or it could mean that my estimates of structural distortions of Quits and Unemployment are both fairly accurate, or it could mean that my estimates are both similarly inaccurate.
In all three cases, I don't see any evidence of an especially weak quits rate. In the time series above, the trend in growth rate of quits does appear to be lower in the current recession than it had been in the previous recession, but I suspect that this has to do with the inverse relationship between quits rates and the unemployment rate. This will only be answered with new data as the unemployment rate drops further. Quits might actually accelerate in 2014, which would be another tailwind for markets next year. Regardless of whether we use the raw labor numbers or my adjusted ones, the Quits rate looks pretty normal, even a little strong, compared to the trend that would smoothly lead Quits back to normal recovery levels.
This may be a case where the demographic adjustment is important. The unadjusted quits data may not look as strong as quits in the previous recovery, due to the older labor force. This may be one of many indicators where a bullish cyclical signal will be retarded by demographic effects.
Forgetting Half of Supply and Demand
I think this is another context where analysts ignore the role and the power of labor supply as an influence on the labor market. There are two factors pressing downward on the Quits rate.
One is a dearth of labor demand, signaled through an elevated unemployment level. This is the influence typically cited. But, this is only half the story.
The other influence is the aging of the labor force. Here, it is the relatively powerful position of labor suppliers that is pushing quits down. Older workers have less churn because they have lower unemployment rates and longer unemployment durations. This is the case because they have more control over their work, more seniority, more income and wealth, less to gain from a career shift, and more frictions in job searching because they tend to have more specialized and senior positions.
The demographic influence isn't huge, in absolute numbers, but if we compare where quits are now, at about 2350 per month, to where we would expect them to be as we neared full employment, around 2800 per month, the supply factor and the demand factor each seem to be contributing about 50% of the difference.
This is one more case where the tendency to view labor markets as if laborers are powerless causes commentators to come to easy conclusions about these issues too quickly.
Monday, December 23, 2013
A couple more thoughts on Emergency Unemployment Insurance
One wrinkle in the changes in North Carolina labor statistics in the period since they cut Emergency Unemployment Insurance (EUI) is that more North Carolinians have left the unemployment rolls than were even enrolled in EUI. Since June, more than 75,000 North Carolinians have exited unemployment, but there were probably only about 30,000 to 35,000 receiving EUI.
This could be because there are many other factors affecting unemployment, so EUI may account for less than half of the net changes.
The End of EUI as Fiscal Stimulus
But, this gets me thinking about the general tenor of discussions about this issue, and one overlooked factor that, to me, seems too obvious to leave aside. There are many pundits who describe EUI as a fiscally stimulative policy. But, especially to the extent that we continue to see a large number of long term unemployed workers, and also especially considering we are 5 years past the shock in real national production, any stimulative effect is likely to be nominal (that is to say, inflationary).
So, if we start from a context where a worker is unemployed and is not receiving benefits, changing to a context where he remains unemployed, but receives benefits, nominal GDP might be increased (assuming a stable monetary policy), but real production at this point is arguably not significantly changed.
But, if at this juncture, a cancellation of benefits leads a portion of EUI recipients to exit unemployment and become employed more quickly than they would have otherwise, then this clearly is a real fiscal stimulus. This will lead to an increase in real GDP.
Now, the overlooked issue is that an increase in employment of this type will have complementary effects. There will be jobs that are complementary to the jobs which are now being filled more quickly, so that there will be some "multiplier" effect from these former EUI workers. And, the new real increase in production should also lead to other complementary increases in economic activity. It is possible that the increase in employment due to the end of EUI will be larger than the actual number of EUI recipients.
Evan Soltas linked to this paper that outlined a logical argument for why moderate unemployment insurance might increase production in the long run because it helps facilitate better job matching, so that productivity improves. But, what that logic is saying is that UI makes up for higher current unemployment with future productivity. Isn't that the opposite of the logic of all the other Keynesian fiscal stimulus policies? Aren't we supposed to be willing to take small decreases in future production in order to increase current production immediately? If these workers are becoming employed as a result of the end of EUI, isn't the end of EUI as effective a fiscal stimulus as we could ask for?
EUI as Bizarro Social Safety Net
Duration of unemployment increases with age and with education levels. This is because older, more educated workers have a better personal safety net, and have more discretion in their work decisions. Even in the oft-referenced situation where older unemployed workers are ironically denied jobs because they are overqualified, the operating issue there is that, because workers in their position tend to have so much more discretion than other workers, they cannot credibly signal a commitment to the job in question. Duration is negatively correlated with desperation.
Here's what median duration of unemployment looks like, by age:
 There are several items to note here:
1) I haven't included 16-24 year olds here. The median for all adults (16+ year olds) is so low because the median duration for 16-24 year olds is very low and 16-34 year olds tend to have a much higher unemployment rate than 35+ year olds, with the unemployment rate decreasing with age.
2) So, 16-34 year olds represent a large proportion of the unemployed, and generally the most vulnerable, since their incomes tend to be lower and they have less savings. Median unemployment for these groups has never been above 10 weeks in any previous recession. So, only a very small percentage of the most vulnerable population has ever benefited from extended UI. Even in the current recession, these age groups topped out at a little over 20 weeks, so that most of them would not have used it.
3) Even among the older groups, median durations topped out at around 15 weeks or less in previous recessions, so that most workers were not affected by EUI. And, the workers who would have used EUI would have tended to be the workers with the highest incomes, the most savings, and the most discretion as a result of their own personal safety nets. Notice how the 55-64 and 65+ age groups are the age groups that show the most inflation in unemployment duration during the recent recession. To the extent that former EUI recipients leave the labor force, we can infer that the vast majority are the workers who were the oldest and wealthiest and who are able or nearly able to qualify for Medicare & Social Security benefits. The GAO survey results corroborate this inference.
In sum, desperate workers generally must find work as quickly as possible, and are not in a position to use EUI. Twenty-six weeks covers the vast majority of them. For each week that is added to UI benefits, the policy will be increasingly targeted to workers who do not need the benefit. I think it would be very illuminating to see the age, average wealth, and lifetime income of workers who were taking EUI benefits beyond 50 weeks.
But there is one additional point I want to make about this graph. This graph only goes back to 1977 because that's how far the age-specific data goes. But, the trend shown here goes all the way back to 1948. Median unemployment durations have never been more than 10 weeks at any time since WWII. The anomaly in the latest recession is stark and unique. This tremendous and unprecedented jump in unemployment duration just happens to coincide with a tremendous and unprecedented jump in EUI benefits. How much of our current perception of a broken labor market is the result of this one policy? Have we found a policy that is self-sustaining? It creates unemployment, and then the existence of that unemployment is cited as the reason why we need the policy?
It so happens that unemployment under 26 weeks is very nearly back to normal. Most of the remaining excess unemployment is long-duration unemployment. That's quite a coincidence. At this point, most of the long-term unemployed are not on EUI, but this raises the question about whether former EUI recipients were incentivized to extend their unemployment duration against their better interests, and now find that they have hobbled themselves with a giant red flag when they try to re-enter the labor market. (No problem. Just blame the employers.)
This also poses another problem for the idea that EUI creates a net benefit in the long term by increasing subsequent worker productivity. If the typical EUI recipient will be earning a full-time income for a decade or less, the payoff of marginally higher productivity will not be substantial, certainly not enough to justify adding a year or more to their unemployment duration.
The Social Cost of Moral Posturing
I can understand the feeling that some people have as guardians of the public safety net. They feel that there are political jackals about that are always trying to undermine the system and leave vulnerable families in dire straits. But, if any discussion about the effectiveness of our current programs is met with a knee-jerk reaction of Dickensian doomsaying, then this social posture is the enemy of a well-functioning safety net. If we can't have reasonable public discussions about the effectiveness of these programs, then they will inevitably be ineffective. Expensive and ineffective social programs are a much larger danger to an effective public social policy than are programs that are too small.
In these discussions, it is important to keep in mind the most vulnerable citizens who might be affected, and to make sure they are protected. But, this goal is not served by public flagellation and concern-peacocking. There are valid reasons why this policy is not in the country's best interest.
And, please note, I am not casting aspersions at recipients of these benefits, or making any moral judgments about anyone's decision to accept or not accept them.
This could be because there are many other factors affecting unemployment, so EUI may account for less than half of the net changes.
The End of EUI as Fiscal Stimulus
But, this gets me thinking about the general tenor of discussions about this issue, and one overlooked factor that, to me, seems too obvious to leave aside. There are many pundits who describe EUI as a fiscally stimulative policy. But, especially to the extent that we continue to see a large number of long term unemployed workers, and also especially considering we are 5 years past the shock in real national production, any stimulative effect is likely to be nominal (that is to say, inflationary).
So, if we start from a context where a worker is unemployed and is not receiving benefits, changing to a context where he remains unemployed, but receives benefits, nominal GDP might be increased (assuming a stable monetary policy), but real production at this point is arguably not significantly changed.
But, if at this juncture, a cancellation of benefits leads a portion of EUI recipients to exit unemployment and become employed more quickly than they would have otherwise, then this clearly is a real fiscal stimulus. This will lead to an increase in real GDP.
Now, the overlooked issue is that an increase in employment of this type will have complementary effects. There will be jobs that are complementary to the jobs which are now being filled more quickly, so that there will be some "multiplier" effect from these former EUI workers. And, the new real increase in production should also lead to other complementary increases in economic activity. It is possible that the increase in employment due to the end of EUI will be larger than the actual number of EUI recipients.
Evan Soltas linked to this paper that outlined a logical argument for why moderate unemployment insurance might increase production in the long run because it helps facilitate better job matching, so that productivity improves. But, what that logic is saying is that UI makes up for higher current unemployment with future productivity. Isn't that the opposite of the logic of all the other Keynesian fiscal stimulus policies? Aren't we supposed to be willing to take small decreases in future production in order to increase current production immediately? If these workers are becoming employed as a result of the end of EUI, isn't the end of EUI as effective a fiscal stimulus as we could ask for?
EUI as Bizarro Social Safety Net
Duration of unemployment increases with age and with education levels. This is because older, more educated workers have a better personal safety net, and have more discretion in their work decisions. Even in the oft-referenced situation where older unemployed workers are ironically denied jobs because they are overqualified, the operating issue there is that, because workers in their position tend to have so much more discretion than other workers, they cannot credibly signal a commitment to the job in question. Duration is negatively correlated with desperation.
Here's what median duration of unemployment looks like, by age:

1) I haven't included 16-24 year olds here. The median for all adults (16+ year olds) is so low because the median duration for 16-24 year olds is very low and 16-34 year olds tend to have a much higher unemployment rate than 35+ year olds, with the unemployment rate decreasing with age.
2) So, 16-34 year olds represent a large proportion of the unemployed, and generally the most vulnerable, since their incomes tend to be lower and they have less savings. Median unemployment for these groups has never been above 10 weeks in any previous recession. So, only a very small percentage of the most vulnerable population has ever benefited from extended UI. Even in the current recession, these age groups topped out at a little over 20 weeks, so that most of them would not have used it.
3) Even among the older groups, median durations topped out at around 15 weeks or less in previous recessions, so that most workers were not affected by EUI. And, the workers who would have used EUI would have tended to be the workers with the highest incomes, the most savings, and the most discretion as a result of their own personal safety nets. Notice how the 55-64 and 65+ age groups are the age groups that show the most inflation in unemployment duration during the recent recession. To the extent that former EUI recipients leave the labor force, we can infer that the vast majority are the workers who were the oldest and wealthiest and who are able or nearly able to qualify for Medicare & Social Security benefits. The GAO survey results corroborate this inference.
In sum, desperate workers generally must find work as quickly as possible, and are not in a position to use EUI. Twenty-six weeks covers the vast majority of them. For each week that is added to UI benefits, the policy will be increasingly targeted to workers who do not need the benefit. I think it would be very illuminating to see the age, average wealth, and lifetime income of workers who were taking EUI benefits beyond 50 weeks.
But there is one additional point I want to make about this graph. This graph only goes back to 1977 because that's how far the age-specific data goes. But, the trend shown here goes all the way back to 1948. Median unemployment durations have never been more than 10 weeks at any time since WWII. The anomaly in the latest recession is stark and unique. This tremendous and unprecedented jump in unemployment duration just happens to coincide with a tremendous and unprecedented jump in EUI benefits. How much of our current perception of a broken labor market is the result of this one policy? Have we found a policy that is self-sustaining? It creates unemployment, and then the existence of that unemployment is cited as the reason why we need the policy?
It so happens that unemployment under 26 weeks is very nearly back to normal. Most of the remaining excess unemployment is long-duration unemployment. That's quite a coincidence. At this point, most of the long-term unemployed are not on EUI, but this raises the question about whether former EUI recipients were incentivized to extend their unemployment duration against their better interests, and now find that they have hobbled themselves with a giant red flag when they try to re-enter the labor market. (No problem. Just blame the employers.)
This also poses another problem for the idea that EUI creates a net benefit in the long term by increasing subsequent worker productivity. If the typical EUI recipient will be earning a full-time income for a decade or less, the payoff of marginally higher productivity will not be substantial, certainly not enough to justify adding a year or more to their unemployment duration.
The Social Cost of Moral Posturing
I can understand the feeling that some people have as guardians of the public safety net. They feel that there are political jackals about that are always trying to undermine the system and leave vulnerable families in dire straits. But, if any discussion about the effectiveness of our current programs is met with a knee-jerk reaction of Dickensian doomsaying, then this social posture is the enemy of a well-functioning safety net. If we can't have reasonable public discussions about the effectiveness of these programs, then they will inevitably be ineffective. Expensive and ineffective social programs are a much larger danger to an effective public social policy than are programs that are too small.
In these discussions, it is important to keep in mind the most vulnerable citizens who might be affected, and to make sure they are protected. But, this goal is not served by public flagellation and concern-peacocking. There are valid reasons why this policy is not in the country's best interest.
And, please note, I am not casting aspersions at recipients of these benefits, or making any moral judgments about anyone's decision to accept or not accept them.
Sunday, December 22, 2013
A Cool Census Map
This is a really cool map, from the Census Department:
http://www.census.gov/censusexplorer/censusexplorer.html
You can see statistics down to the level of the census tract.
A couple things it really helps to visualize are, (1) how segregated we are in so many ways, (2) how much labor force participation correlates with incomes, (3) and, hence, how segregated we are by labor force participation, and (4) how much high incomes are building around Washington, D.C.
I am sure there are many other interesting things to capture from this map. I think Choropleth mode is the best way to look at it.
The income inequality among neighborhoods is really easy to see here. The incomes around the boroughs of NYC are interesting.
http://www.census.gov/censusexplorer/censusexplorer.html
You can see statistics down to the level of the census tract.
A couple things it really helps to visualize are, (1) how segregated we are in so many ways, (2) how much labor force participation correlates with incomes, (3) and, hence, how segregated we are by labor force participation, and (4) how much high incomes are building around Washington, D.C.
I am sure there are many other interesting things to capture from this map. I think Choropleth mode is the best way to look at it.
The income inequality among neighborhoods is really easy to see here. The incomes around the boroughs of NYC are interesting.
Friday, December 20, 2013
More on North Carolina Unemployment Insurance
Evan Soltas, who was the one that got me looking into this, has an update on the issue here:
http://esoltas.blogspot.com/2013/12/more-on-north-carolina.html
He adds this graph:

This graph makes it look like the reduction in unemployment is completely related to exits from the labor force. I'm not sure about the graph. It's comparing a current rate, to the year-over-year change in another rate, to the year-over-year change in a raw quantity. There is enough noise in these series already.
Here, I have changed the three measures to month-over-month, seasonally adjusted changes, in thousands of persons, just showing the last two years for more clarity:

In the last 4 months, the North Carolina unemployment rate has dropped by an average of more than 0.4%, per month. At the national level, only about 0.75% of the labor force is even on EUI at this point, which adds another wrinkle to the interpretation here.
In the end, while messy data series are the means we use to argue, my reading of Evan's argument is that he considers any drop in the unemployment rate that results from the drop in EUI benefits to be problematic. If they drop out of the labor force, he suspects that EUI would have kept them engaged in job hunting. If they become employed, he suspects that they would have benefited by waiting longer to find a better job.
So, data or no data, this really comes down to a philosophical or narrative choice. We have to be careful here to avoid "mood affiliation", or narrative thinking where we imagine a typical worker. There were probably around 35,000 people collecting EUI in North Carolina, with 35,000 narratives. So, when Evan prints things like,
For the single 30 year old mother who has been out of work for 18 months, there are other programs. She will apply for SNAP, and she should.
On the issue of former EUI recipients who are now employed, earlier than they might have been, Evan cites this paper from Daron Acemoglu and Robert Shimer about the productivity benefits of unemployment insurance. But, I believe that paper concerns itself with moderate levels of UI around 26 weeks. This roughly describes the level North Carolina has reverted to, and that the US will probably be returning to. I don't believe that paper offers a defense of 99 week, or even 75 week UI, and Evan is ignoring the problem of hysteresis for longer spells of unemployment.
This isn't a decision between a carefully calibrated safety net and no safety net at all. This is a decision between a broad, temporary policy, which has uncertain ramifications and a return to the normal, highly developed system of social support that the country generally supports as a general proposition. The food banks Evan references are part of that support system, as well as many public programs that dwarf the reach of EUI.
(A couple closing comments, here.)
Edit: It was bothering me that the graphs in this post were based on data from both the establishment and the household survey. Here is the graph with all of the numbers from the household survey, so the summed changes in employment and unemployment should equal the change in the labor force, for each month. The basic trends are the same, but this is a little more coherent to me (green is employment, blue is unemployment, red is labor force, all are expressed as monthly changes in thousands of people):

http://esoltas.blogspot.com/2013/12/more-on-north-carolina.html
He adds this graph:
This graph makes it look like the reduction in unemployment is completely related to exits from the labor force. I'm not sure about the graph. It's comparing a current rate, to the year-over-year change in another rate, to the year-over-year change in a raw quantity. There is enough noise in these series already.
Here, I have changed the three measures to month-over-month, seasonally adjusted changes, in thousands of persons, just showing the last two years for more clarity:
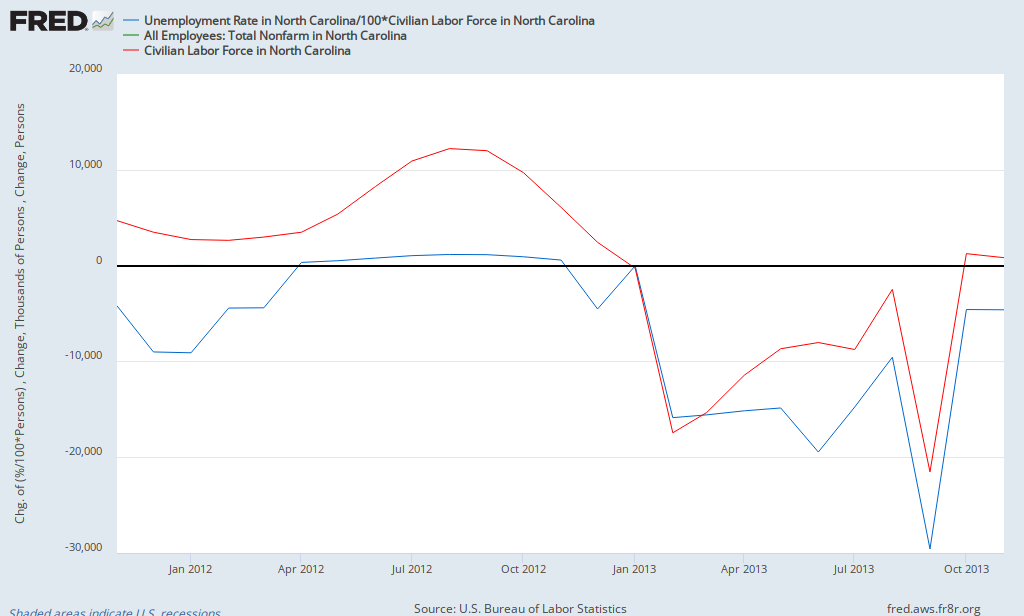
In the last 4 months, the North Carolina unemployment rate has dropped by an average of more than 0.4%, per month. At the national level, only about 0.75% of the labor force is even on EUI at this point, which adds another wrinkle to the interpretation here.
In the end, while messy data series are the means we use to argue, my reading of Evan's argument is that he considers any drop in the unemployment rate that results from the drop in EUI benefits to be problematic. If they drop out of the labor force, he suspects that EUI would have kept them engaged in job hunting. If they become employed, he suspects that they would have benefited by waiting longer to find a better job.
So, data or no data, this really comes down to a philosophical or narrative choice. We have to be careful here to avoid "mood affiliation", or narrative thinking where we imagine a typical worker. There were probably around 35,000 people collecting EUI in North Carolina, with 35,000 narratives. So, when Evan prints things like,
"I think that it is likely that, on the margin, the "active search" requirement is more powerful in keeping people in the labor force than is desperation."I think he's making several errors of binary, narrative thinking. Isn't there a middle ground between bureaucratic requirements and desperation that is more populated than these two poles? (Long term unemployed do skew older and more educated. The GAO found that of the people who exhausted EUI, more of them ended up moving into social security programs than into SNAP programs. And less than 1/4 had left the labor force.) Is it the goal of every person with long-duration unemployment to be in the labor force as often and as soon as possible? I don't actually quite know what to make of this sentence. If we are thinking on the margin, are we thinking of someone ruled by desperation? I wouldn't expect the desperate person to make their labor force participation dependent on their benefit status. I would expect the marginal person to be, say, a guy in his 50's whose wife is working, who almost has the house paid off, who has saved some money for retirement, but not quite as much as he would like. He sincerely would like to take a job when the right one comes along. Etc. He probably doesn't need 99 weeks of UI, not that he can't use the money. He isn't in any position to claim another type of public support. It seems reasonable to collect EUI. Nobody's shaming him for it. But, he's not going to go apply for SNAP.
For the single 30 year old mother who has been out of work for 18 months, there are other programs. She will apply for SNAP, and she should.
On the issue of former EUI recipients who are now employed, earlier than they might have been, Evan cites this paper from Daron Acemoglu and Robert Shimer about the productivity benefits of unemployment insurance. But, I believe that paper concerns itself with moderate levels of UI around 26 weeks. This roughly describes the level North Carolina has reverted to, and that the US will probably be returning to. I don't believe that paper offers a defense of 99 week, or even 75 week UI, and Evan is ignoring the problem of hysteresis for longer spells of unemployment.
This isn't a decision between a carefully calibrated safety net and no safety net at all. This is a decision between a broad, temporary policy, which has uncertain ramifications and a return to the normal, highly developed system of social support that the country generally supports as a general proposition. The food banks Evan references are part of that support system, as well as many public programs that dwarf the reach of EUI.
(A couple closing comments, here.)
Edit: It was bothering me that the graphs in this post were based on data from both the establishment and the household survey. Here is the graph with all of the numbers from the household survey, so the summed changes in employment and unemployment should equal the change in the labor force, for each month. The basic trends are the same, but this is a little more coherent to me (green is employment, blue is unemployment, red is labor force, all are expressed as monthly changes in thousands of people):
November Update on North Carolina Labor and Unemployment Policy
Here are the updated charts:

Considering how strong the national employment report was in November, this is a very strong continuation of the trends in North Carolina.
The unemployment rate in North Carolina dropped 0.6% in November, and has dropped by 1.5% since July.
 Relative to national trends, the North Carolina unemployment rate has dropped by 1.0% since July. At this point, the movement from unemployment looks roughly split. During this time, North Carolina's Employment-to-Population ratio is up 0.4%, relative to the national number, and its Labor Force Participation rate is down 0.3%.
 These are noisy data series, and I still expect the following few months to help break out the noise from the trends. The October data might have overstated the success of the North Carolina policy. The November data might be understating it.
 I know this is just one state, and that there are a lot of moving parts that make it difficult to draw distinctions with certainty. But, this is extremely good news. If this is indicative at all of what we can expect at the national level after EUI lapses, then we could be seeing an unemployment rate under 6% next year.
PS. One reason I suspect that the activity between January and July may be generally unrelated is that we don't see much change in regular unemployment insurance claims until June:

And this graph of North Carolina employment shows how difficult it is to differentiate anything from the noise. The problem is that we consider changes in unemployment of a couple of percent to be catastrophic, so that any issue can be either written off as a rounding error or be cast as the end of the working class, using the same data. The dip in early 2013 is the mysterious period of employment loss, and the little pick up there at the end is the part that would suggest that EUI was causing disemployment issues. If we weren't looking for any effect, this line would just look like a normal data series with nothing unusual going on after 2009 - with a few blips and wiggles along the way.

Here's another update. And, a couple of closing comments.

Considering how strong the national employment report was in November, this is a very strong continuation of the trends in North Carolina.
The unemployment rate in North Carolina dropped 0.6% in November, and has dropped by 1.5% since July.
 Relative to national trends, the North Carolina unemployment rate has dropped by 1.0% since July. At this point, the movement from unemployment looks roughly split. During this time, North Carolina's Employment-to-Population ratio is up 0.4%, relative to the national number, and its Labor Force Participation rate is down 0.3%.
 These are noisy data series, and I still expect the following few months to help break out the noise from the trends. The October data might have overstated the success of the North Carolina policy. The November data might be understating it.
PS. One reason I suspect that the activity between January and July may be generally unrelated is that we don't see much change in regular unemployment insurance claims until June:
And this graph of North Carolina employment shows how difficult it is to differentiate anything from the noise. The problem is that we consider changes in unemployment of a couple of percent to be catastrophic, so that any issue can be either written off as a rounding error or be cast as the end of the working class, using the same data. The dip in early 2013 is the mysterious period of employment loss, and the little pick up there at the end is the part that would suggest that EUI was causing disemployment issues. If we weren't looking for any effect, this line would just look like a normal data series with nothing unusual going on after 2009 - with a few blips and wiggles along the way.

Here's another update. And, a couple of closing comments.
Subscribe to:
Posts (Atom)